

Question
Tim DaSilva is impressed by the quality of your analysis. He needs some additional help this time with evaluating how one of his companys Walliver
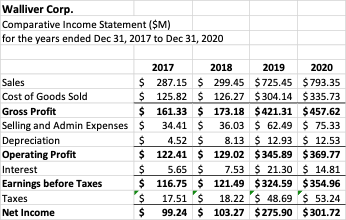
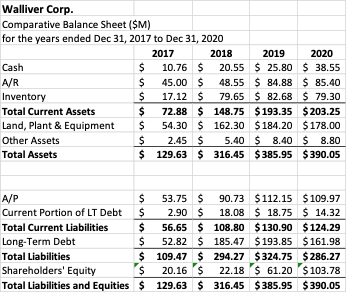
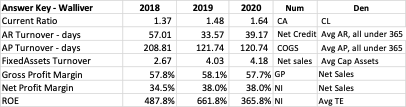
Tim DaSilva is impressed by the quality of your analysis. He needs some additional help this time with evaluating how one of his companys Walliver Corporation (WAC) - is performing. WAC is a chain of retail stores operating across Canada. Tim has asked you to perform some financial statement analysis. He asks that you look at how the company has performed relative to history and industry benchmarks. He wants you to calculate the following ratios for each of 2018, 2019 and 2020, using the data he provides below. Be sure to comment on what you think the results mean. He has also included industry information that you can use in your analysis. Note that for the ROA and ROE, you should use the average total assets and the average total equity in your calculations. For turnover ratios, please also use the average. (e.g., for Accounts Receivable Turnover, take Credit Sales / Average Accounts Receivable for the year). 1. Current ratio 2. Account Receivable turnover days; all sales are credit sales 3. Accounts Payable turnover days 4. Fixed Asset Turnover 5. Gross Profit margin 6. Net Profit Margin 7. Return on Equity Industry Benchmarks Current Ratio 1.35 Cash Ratio 0.25 Inventory Turnover (days) 40.12 AR Turnover (days) 34.5 AP Turnover (days) 50.1 Fixed Asset Turnover 3.5 Total Asset Turnover 1.75 Debt Ratio 0.5 Times Interest earned 10.5 Gross Profit Margin 28% Operating Profit Margin 12% Net Profit Margin 7.50% ROA 15.50% ROE 37.50%
- Current ratio
- Account Receivable turnover days; all sales are credit sales
- Accounts Payable turnover days
- Fixed Asset Turnover
- Gross Profit margin
- Net Profit Margin
- Return on Equity
| Industry Benchmarks |
|
|
|
|
| Current Ratio | 1.35 |
| Cash Ratio | 0.25 |
| Inventory Turnover (days) | 40.12 |
| AR Turnover (days) | 34.5 |
| AP Turnover (days) | 50.1 |
| Fixed Asset Turnover | 3.5 |
| Total Asset Turnover | 1.75 |
| Debt Ratio | 0.5 |
| Times Interest earned | 10.5 |
| Gross Profit Margin | 28% |
| Operating Profit Margin | 12% |
| Net Profit Margin | 7.50% |
| ROA | 15.50% |
| ROE | 37.50% |
Step by Step Solution
There are 3 Steps involved in it
Step: 1

Get Instant Access to Expert-Tailored Solutions
See step-by-step solutions with expert insights and AI powered tools for academic success
Step: 2

Step: 3
Ace Your Homework with AI
Get the answers you need in no time with our AI-driven, step-by-step assistance
Get Started
Financial management theory and practice
Authors: Eugene F. Brigham and Michael C. Ehrhardt
13th edition
1439078106, 111197375X, 9781439078105, 9781111973759, 978-1439078099