

Answered step by step
Verified Expert Solution
Question
1 Approved Answer
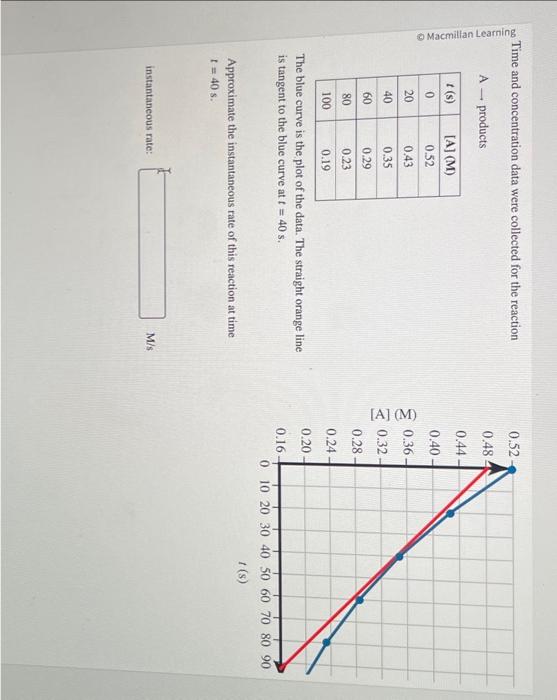
Time and concentration data were collected for the reaction Aproducts The blue curve is the plot of the data. The straight orange line is tangent
Step by Step Solution
There are 3 Steps involved in it
Step: 1

Get Instant Access to Expert-Tailored Solutions
See step-by-step solutions with expert insights and AI powered tools for academic success
Step: 2

Step: 3
Ace Your Homework with AI
Get the answers you need in no time with our AI-driven, step-by-step assistance
Get Started
Chemistry
Authors: John McMurry, Robert C. Fay
4th Edition
131402080, 978-0131402089