Answered step by step
Verified Expert Solution
Question
1 Approved Answer
Time Complexity of Sorting Algorithms Your final report should give an overall description of the sorting algorithms you chose to implement and any characteristics of
Time Complexity of Sorting Algorithms

Your final report should give an overall description of the sorting algorithms you chose to implement and any characteristics of those algorithms. You should also include a section to describe your results and a discussion of those results. In particular you should make sure you include a discussion of the impact of the different types of input (average case, best case and worst case) on the sorting algorithms. Also include the R Language code for the two algorithms you have chosen to implement.
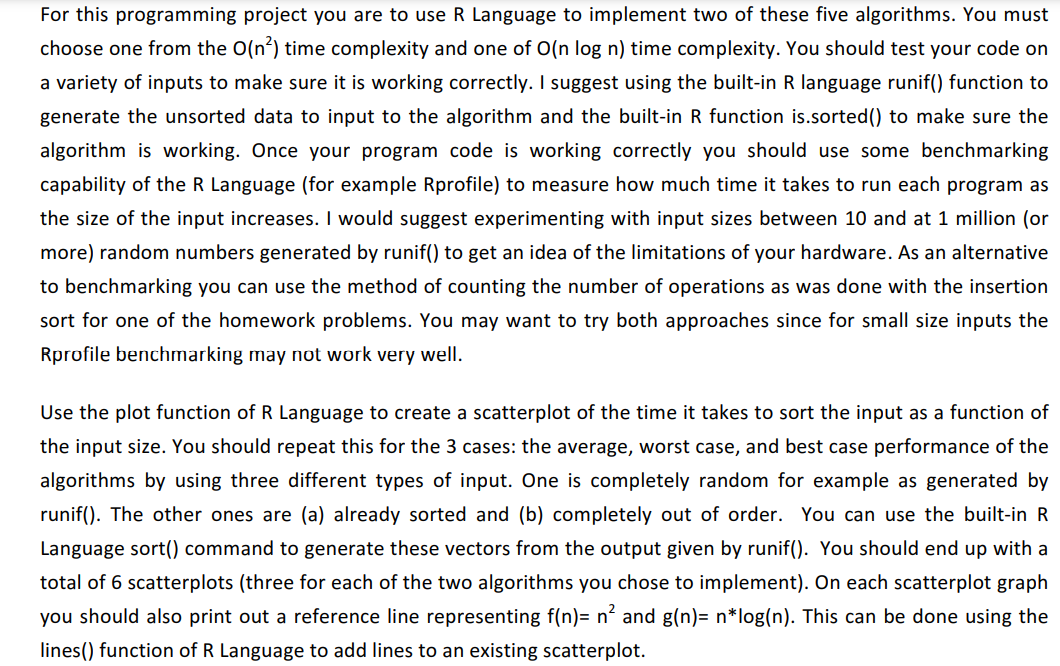
For this programming project you are to use R Language to implement two of these five algorithms. You must choose one from the O(n2) time complexity and one of O(nlogn) time complexity. You should test your code on a variety of inputs to make sure it is working correctly. I suggest using the built-in R language runif() function to generate the unsorted data to input to the algorithm and the built-in R function is.sorted() to make sure the algorithm is working. Once your program code is working correctly you should use some benchmarking capability of the R Language (for example Rprofile) to measure how much time it takes to run each program as the size of the input increases. I would suggest experimenting with input sizes between 10 and at 1 million (or more) random numbers generated by runif() to get an idea of the limitations of your hardware. As an alternative to benchmarking you can use the method of counting the number of operations as was done with the insertion sort for one of the homework problems. You may want to try both approaches since for small size inputs the Rprofile benchmarking may not work very well. Use the plot function of R Language to create a scatterplot of the time it takes to sort the input as a function of the input size. You should repeat this for the 3 cases: the average, worst case, and best case performance of the algorithms by using three different types of input. One is completely random for example as generated by runif(). The other ones are (a) already sorted and (b) completely out of order. You can use the built-in R Language sort() command to generate these vectors from the output given by runif(). You should end up with a total of 6 scatterplots (three for each of the two algorithms you chose to implement). On each scatterplot graph you should also print out a reference line representing f(n)=n2 and g(n)=nlog(n). This can be done using the lines() function of R Language to add lines to an existing scatterplotStep by Step Solution
There are 3 Steps involved in it
Step: 1

Get Instant Access to Expert-Tailored Solutions
See step-by-step solutions with expert insights and AI powered tools for academic success
Step: 2

Step: 3

Ace Your Homework with AI
Get the answers you need in no time with our AI-driven, step-by-step assistance
Get Started


