Answered step by step
Verified Expert Solution
Link Copied!

Question

1 Approved Answer

Time data: o {b} Fit the regression model a, = 1M1(t) + 2M2(t) + - -- + 12M12(t) + wtl v noise where Mi (t)

Time data:
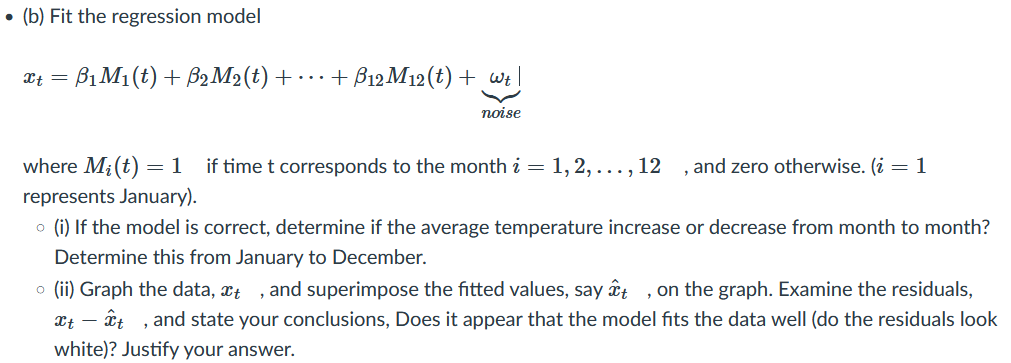
image text in transcribed
o {b} Fit the regression model a, = 1M1(t) + 2M2(t) + - -- + 12M12(t) + wtl v noise where Mi (t) = 1 iftime t corresponds to the month 3' = 1, 2, . . . , 12 , and zero otherwise. [i = 1 represents January}. 0 (i) If the model is correct, determine if the average temperature increase or decrease from month to month? Determine this from January to December. 0 (ii) Graph the data, m , and superimpose the tted values, say :33; , on the graph. Examine the residuals. art 5:; , and state your conclusions, Does it appear that the model ts the data well (do the residuals look white)? Justify your

Step by Step Solution

There are 3 Steps involved in it

Step: 1

blur-text-image

Get Instant Access to Expert-Tailored Solutions

See step-by-step solutions with expert insights and AI powered tools for academic success

Step: 2

blur-text-image_2

Step: 3

blur-text-image_3

Ace Your Homework with AI

Get the answers you need in no time with our AI-driven, step-by-step assistance

Get Started

Recommended Textbook for

Calculus

Authors: Laura Taalman, Peter Kohn

1st Edition

1464153035, 9781464153037

More Books

Students also viewed these Mathematics questions

Question

8. Do the organizations fringe benefits reflect diversity?

Answered: 1 week ago

Question

7. Do the organizations social activities reflect diversity?

Answered: 1 week ago