

Answered step by step
Verified Expert Solution
Question
1 Approved Answer
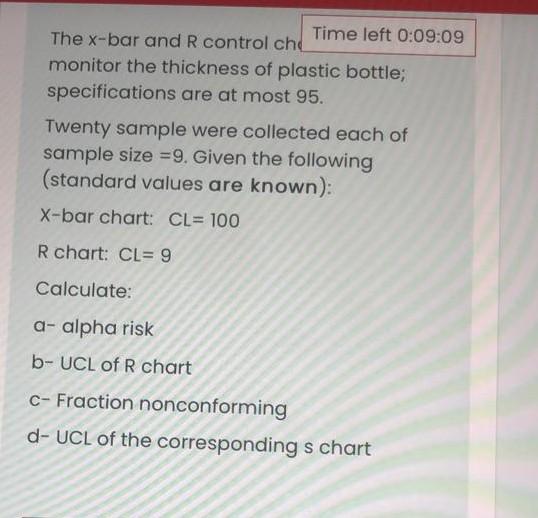
Time left 0:09:09 The x-bar and R control che monitor the thickness of plastic bottle; specifications are at most 95. Twenty sample were collected each
Step by Step Solution
There are 3 Steps involved in it
Step: 1

Get Instant Access to Expert-Tailored Solutions
See step-by-step solutions with expert insights and AI powered tools for academic success
Step: 2

Step: 3
Ace Your Homework with AI
Get the answers you need in no time with our AI-driven, step-by-step assistance
Get Started
Algebra And Trigonometry
Authors: Cynthia Y Young
5th Edition
1119820898, 9781119820895