

Question: Time Limit: 00:50:00 Submit Quiz This Question: 1 pt 1 of 15 (0 comfigte) This Quiz: 15 pts possible Overview, question 1 of 15,0 complete
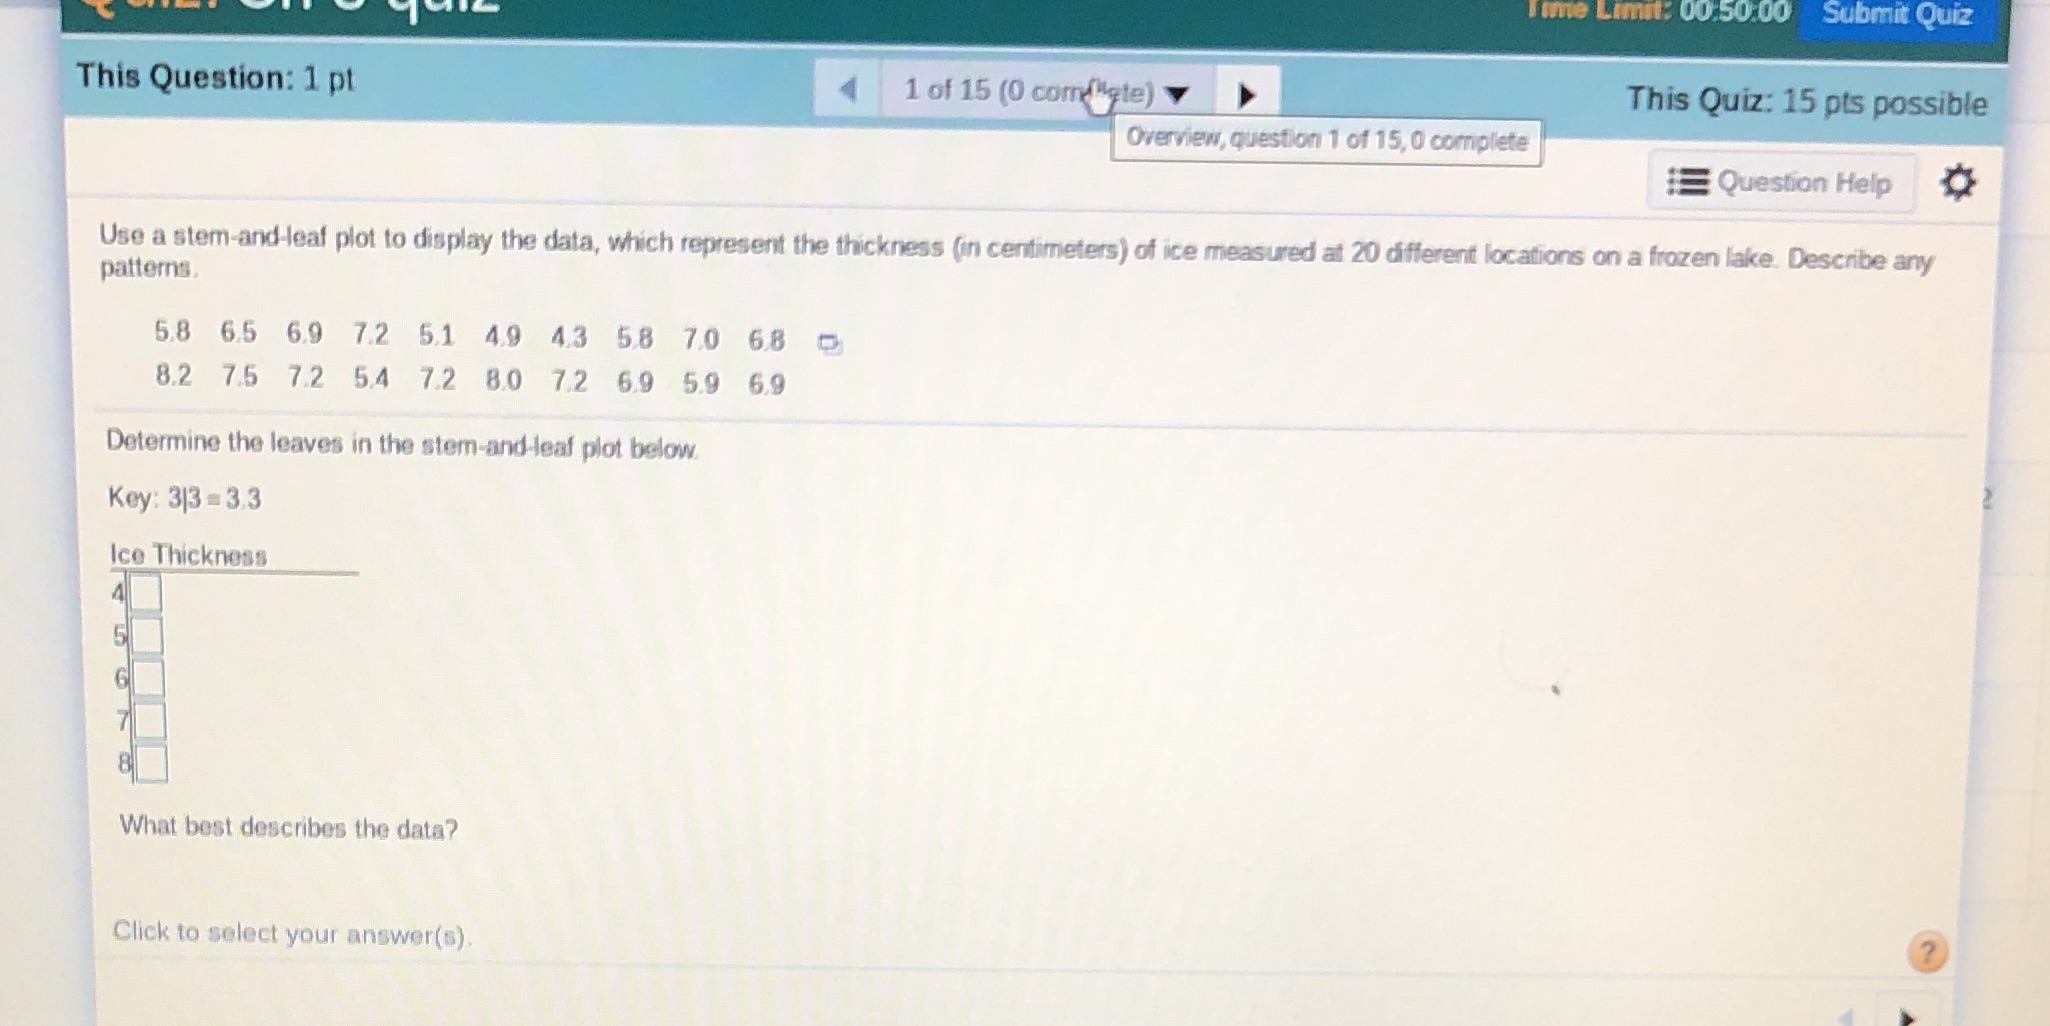
Time Limit: 00:50:00 Submit Quiz This Question: 1 pt 1 of 15 (0 comfigte) This Quiz: 15 pts possible Overview, question 1 of 15,0 complete Question Help Use a stem-and-leaf plot to display the data, which represent the thickness (in centimeters) of ice measured at 20 different locations on a frozen lake. Describe any patterns. 58 65 6.9 72 51 49 43 58 70 68 0 8.2 7.5 72 54 72 80 72 69 59 6.9 Determine the leaves in the stem-and leaf plot below Key: 313 = 3.3 Ice Thickness What best describes the data? Click to select your answer(s)
Step by Step Solution
There are 3 Steps involved in it
1 Expert Approved Answer
Step: 1 Unlock

Question Has Been Solved by an Expert!
Get step-by-step solutions from verified subject matter experts
Step: 2 Unlock
Step: 3 Unlock