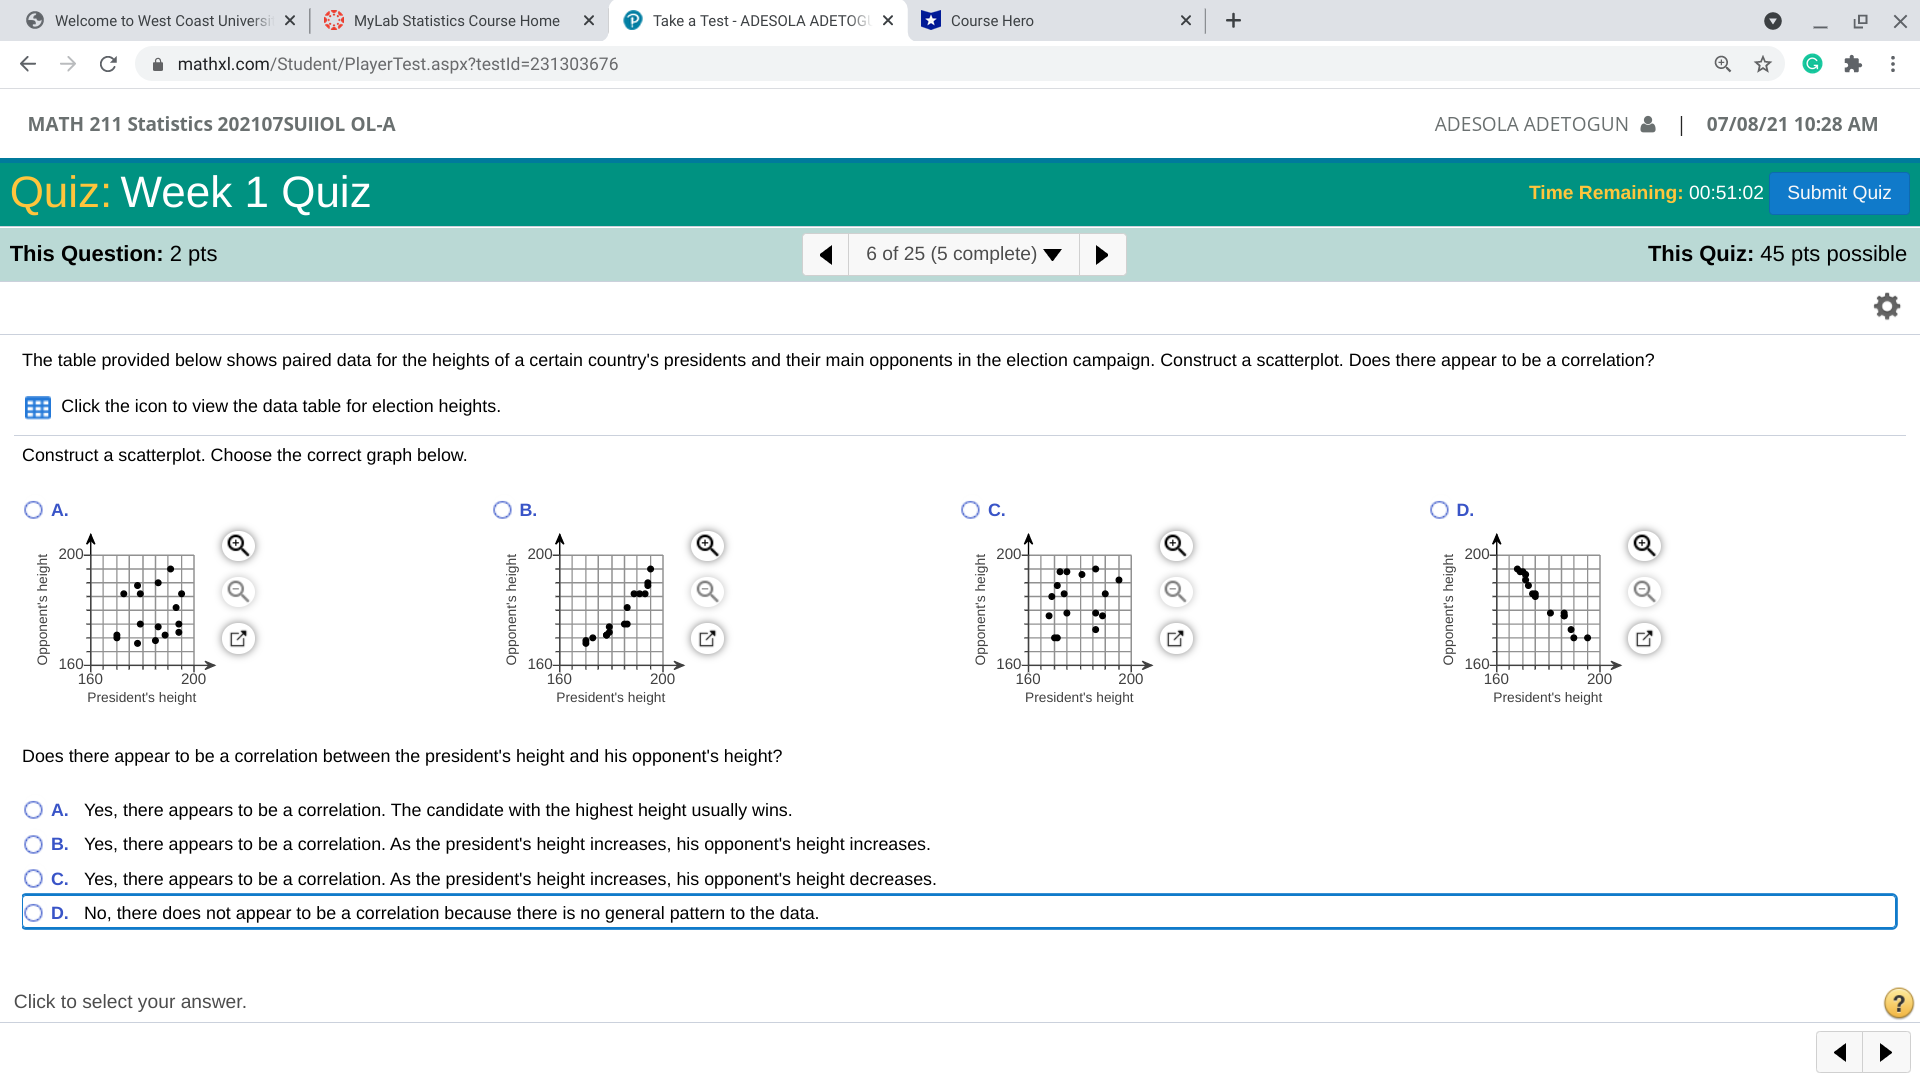
Welcome to West Coast Universi X MyLab Statistics Course Home X Take a Test - ADESOLA ADETOGI X Course Hero X + X -> C a mathxl.com/Student/PlayerTest.aspx?testld=231303676 G MATH 211 Statistics 202107SUIIOL OL-A ADESOLA ADETOGUN & | 07/08/21 10:24 AM Quiz: Week 1 Quiz Time Remaining: 00:55:08 Submit Quiz This Question: 1 pt 2 of 25 (1 complete) This Quiz: 45 pts possible Determine whether the results below appear to have statistical significance, and also determine whether the results have practical significance. In a study of a weight loss program, 7 subjects lost an average of 50 lbs. It is found that there is about a 31% chance of getting such results with a diet that has no effect. Does the weight loss program have statistical significance? A. No, the program is not statistically significant because the results are unlikely to occur by chance. O B. Yes, the program is statistically significant because the results are unlikely to occur by chance. C. Yes, the program is statistically significant because the results are likely to occur by chance. O D. No, the program is not statistically significant because the results are likely to occur by chance. Does the weight loss program have practical significance? O A. Yes, the program is practically significant because the results are too unlikely to occur by chance. O B. No, the program is not practically significant because the results are likely to occur even if the weight loss program has no effect. O C. No, the program is not practically significant because the amount of weight lost is trivial. O D. Yes, the program is practically significant because the amount of lost weight is large enough to be considered practically significant. Click to select your answer. ?u 0 Welcome to West Coast Universl x 6.; MyLah Statistics Course Home x 9 Take a Test -ADESOLA ADETOG x Course Hem x l + o _ LEI x (- $ (3' i mathxI.com/Student/PlayerTestaspxttestld=231303676 9 *- ; MATH 211 Statistics 202107SUI|OL DL-A ADESOLA ADETOGUN B l 07I08I21 10:25 AM UiZ. Week l [\"2 Time Remaining 00 11 SumetQ This Question: 2 pts { 4 or 25 (3 complete) v p This Quiz: 45 pts possible 0 In a double-blind experiment designed to test the effectiveness of a new medication as a treatment for lower back pain, 1643 patients were randomly assigned to one at three groups: (1) the 547 subjects in the placebo group were given pills containing no medication; (2) 550 subjects were in a group given pills with the new medication taken at regular intervals: (3) 546 subjects were in a group given pills with the new medication to be taken when needed for pain relief. What does it mean to say that the experiment was "double-blind"? Choose the correct answer below. 0 A. The subjects in the study did not know whether they were taking a placebo or the new medication, and those who administered the pills also did not know. 0 B. The subjects in the study did not know whether they were taking a placebo or the new medication, but those who administered the pills did know. 0 C. The subjects in the study were given the choice of taking the placebo or the new medication, but those who administered the pills did not know which group the subjects were in. O D. Both the subjects in the study and those who administered the pills knew whether they were taking a placebo or the new medication. Click to select your answer. Welcome to West Coast Universi X MyLab Statistics Course Home X Take a Test - ADESOLA ADETOGI X Course Hero X + X -> C a mathxl.com/Student/PlayerTest.aspx?testld=231303676 G MATH 211 Statistics 202107SUIIOL OL-A ADESOLA ADETOGUN & | 07/08/21 10:27 AM Quiz: Week 1 Quiz Time Remaining: 00:51:51 Submit Quiz This Question: 2 pts 5 of 25 (4 complete) This Quiz: 45 pts possible If we find that there is a linear correlation between the concentration of carbon dioxide in our atmosphere and the global temperature, does that indicate that changes in the concentration of carbon dioxide cause changes in the global temperature? Choose the correct answer below. O A. Yes. The presence of a linear correlation between two variables implies that one of the variables is the cause of the other variable. O B. No. The presence of a linear correlation between two variables does not imply that one of the variables is the cause of the other variable. Click to select your answer. ?Welcome to West Coast Universi X MyLab Statistics Course Home X Take a Test - ADESOLA ADETOGI X Course Hero X + X -> C a mathxl.com/Student/PlayerTest.aspx?testld=231303676 G MATH 211 Statistics 202107SUIIOL OL-A ADESOLA ADETOGUN & | 07/08/21 10:28 AM Quiz: Week 1 Quiz Time Remaining: 00:51:02 Submit Quiz This Question: 2 pts 6 of 25 (5 complete) This Quiz: 45 pts possible The table provided below shows paired data for the heights of a certain country's presidents and their main opponents in the election campaign. Construct a scatterplot. Does there appear to be a correlation? Click the icon to view the data table for election heights. Construct a scatterplot. Choose the correct graph below. O A. O B. O C. O D. A 200- 200- 209- 200- Opponent's height Opponent's height Opponent's height Opponent's height 160- 160- 160- 160- 160 200 160 200 160 200 160 200 President's height President's height President's height President's height Does there appear to be a correlation between the president's height and his opponent's height? O A. Yes, there appears to be a correlation. The candidate with the highest height usually wins. O B. Yes, there appears to be a correlation. As the president's height increases, his opponent's height increases. C. Yes, there appears to be a correlation. As the president's height increases, his opponent's height decreases. O D. No, there does not appear to be a correlation because there is no general pattern to the data. Click to select your


