

Answered step by step
Verified Expert Solution
Question
1 Approved Answer
Time (s) 0 1 2 3 4 10 mM Substrate A B -0.00247 0.00163 -0.00382 6.557698 4.764013 3.292949 13.11457 9.530525 6.576659 19.66795 14.30117 9.871928 26.22663
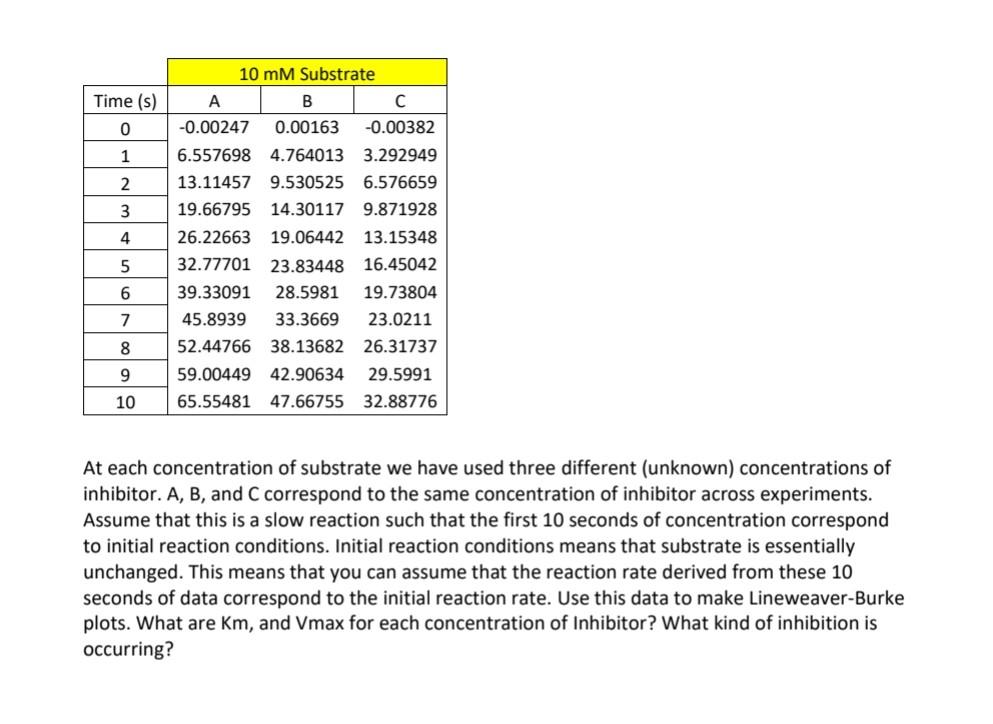
Time (s) 0 1 2 3 4 10 mM Substrate A B -0.00247 0.00163 -0.00382 6.557698 4.764013 3.292949 13.11457 9.530525 6.576659 19.66795 14.30117 9.871928 26.22663 19.06442 13.15348 32.77701 23.83448 16.45042 39.33091 28.5981 19.73804 45.8939 33.3669 23.0211 52.44766 38.13682 26.31737 59.00449 42.90634 29.5991 65.55481 47.66755 32.88776 5 6 7 8 9 10 At each concentration of substrate we have used three different (unknown) concentrations of inhibitor. A, B, and C correspond to the same concentration of inhibitor across experiments. Assume that this is a slow reaction such that the first 10 seconds of concentration correspond to initial reaction conditions. Initial reaction conditions means that substrate is essentially unchanged. This means that you can assume that the reaction rate derived from these 10 seconds of data correspond to the initial reaction rate. Use this data to make Lineweaver-Burke plots. What are Km, and Vmax for each concentration of Inhibitor? What kind of inhibition is occurring? Time (s) 0 1 2 3 4 10 mM Substrate A B -0.00247 0.00163 -0.00382 6.557698 4.764013 3.292949 13.11457 9.530525 6.576659 19.66795 14.30117 9.871928 26.22663 19.06442 13.15348 32.77701 23.83448 16.45042 39.33091 28.5981 19.73804 45.8939 33.3669 23.0211 52.44766 38.13682 26.31737 59.00449 42.90634 29.5991 65.55481 47.66755 32.88776 5 6 7 8 9 10 At each concentration of substrate we have used three different (unknown) concentrations of inhibitor. A, B, and C correspond to the same concentration of inhibitor across experiments. Assume that this is a slow reaction such that the first 10 seconds of concentration correspond to initial reaction conditions. Initial reaction conditions means that substrate is essentially unchanged. This means that you can assume that the reaction rate derived from these 10 seconds of data correspond to the initial reaction rate. Use this data to make Lineweaver-Burke plots. What are Km, and Vmax for each concentration of Inhibitor? What kind of inhibition is occurring
Step by Step Solution
There are 3 Steps involved in it
Step: 1

Get Instant Access to Expert-Tailored Solutions
See step-by-step solutions with expert insights and AI powered tools for academic success
Step: 2

Step: 3
Ace Your Homework with AI
Get the answers you need in no time with our AI-driven, step-by-step assistance
Get Started
Principles and Modern Applications of Mass Transfer Operations
Authors: Jaime Benitez
2nd edition
470181788, 470181782, 978-1-119-0427, 978-0470181782