Answered step by step
Verified Expert Solution
Link Copied!

Question

1 Approved Answer

Time (s) Absorbance begin{tabular}{|c|c|} hline 0 & 0.928 hline 20 & 0.899 hline 40 & 0.846 hline 60 & 0.809 hline
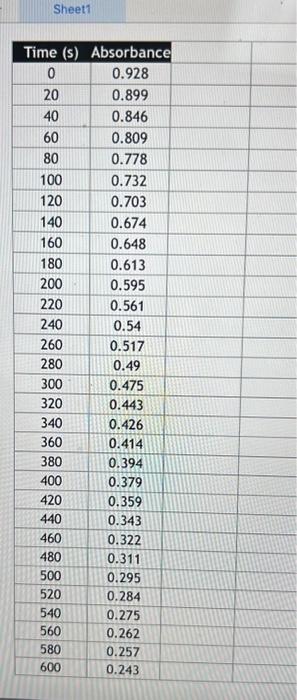
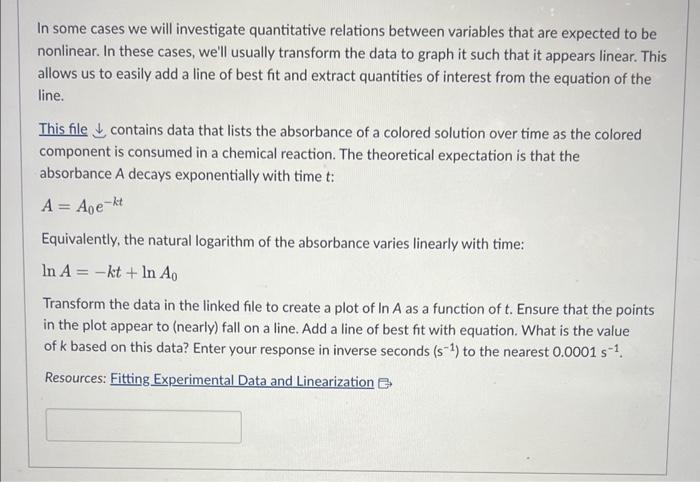
image text in transcribed
Time (s) Absorbance \begin{tabular}{|c|c|} \hline 0 & 0.928 \\ \hline 20 & 0.899 \\ \hline 40 & 0.846 \\ \hline 60 & 0.809 \\ \hline 80 & 0.778 \\ \hline 100 & 0.732 \\ \hline 120 & 0.703 \\ \hline 140 & 0.674 \\ \hline 160 & 0.648 \\ \hline 180 & 0.613 \\ \hline 200 & 0.595 \\ \hline 220 & 0.561 \\ \hline 240 & 0.54 \\ \hline 260 & 0.517 \\ \hline 280 & 0.49 \\ \hline 300 & 0.475 \\ \hline 320 & 0.443 \\ \hline 340 & 0.426 \\ \hline 360 & 0.414 \\ \hline 380 & 0.394 \\ \hline 400 & 0.379 \\ \hline 420 & 0.359 \\ \hline 440 & 0.343 \\ \hline 460 & 0.322 \\ \hline 480 & 0.311 \\ \hline 500 & 0.295 \\ \hline 520 & 0.284 \\ \hline 540 & 0.275 \\ \hline 560 & 0.262 \\ \hline 580 & 0.257 \\ \hline 600 & 0.243 \\ \hline & \\ \hline \end{tabular} In some cases we will investigate quantitative relations between variables that are expected to be nonlinear. In these cases, we'll usually transform the data to graph it such that it appears linear. This allows us to easily add a line of best fit and extract quantities of interest from the equation of the line. This file contains data that lists the absorbance of a colored solution over time as the colored component is consumed in a chemical reaction. The theoretical expectation is that the absorbance A decays exponentially with time t : A=A0ekt Equivalently, the natural logarithm of the absorbance varies linearly with time: lnA=kt+lnA0 Transform the data in the linked file to create a plot of lnA as a function of t. Ensure that the points in the plot appear to (nearly) fall on a line. Add a line of best fit with equation. What is the value of k based on this data? Enter your response in inverse seconds (s1) to the nearest 0.0001s1. Resources: Fitting Experimental Data and Linearization 6

Step by Step Solution

There are 3 Steps involved in it

Step: 1

blur-text-image

Get Instant Access to Expert-Tailored Solutions

See step-by-step solutions with expert insights and AI powered tools for academic success

Step: 2

blur-text-image_2

Step: 3

blur-text-image_3

Ace Your Homework with AI

Get the answers you need in no time with our AI-driven, step-by-step assistance

Get Started

Recommended Textbook for

Statistical Reasoning for Everyday Life

Authors: Jeff Bennett, Bill Briggs, Mario F. Triola

4th edition

978-0321817747, 321817745, 978-0321890139, 321890132, 321817621, 978-0321817624

More Books

Students also viewed these Chemistry questions