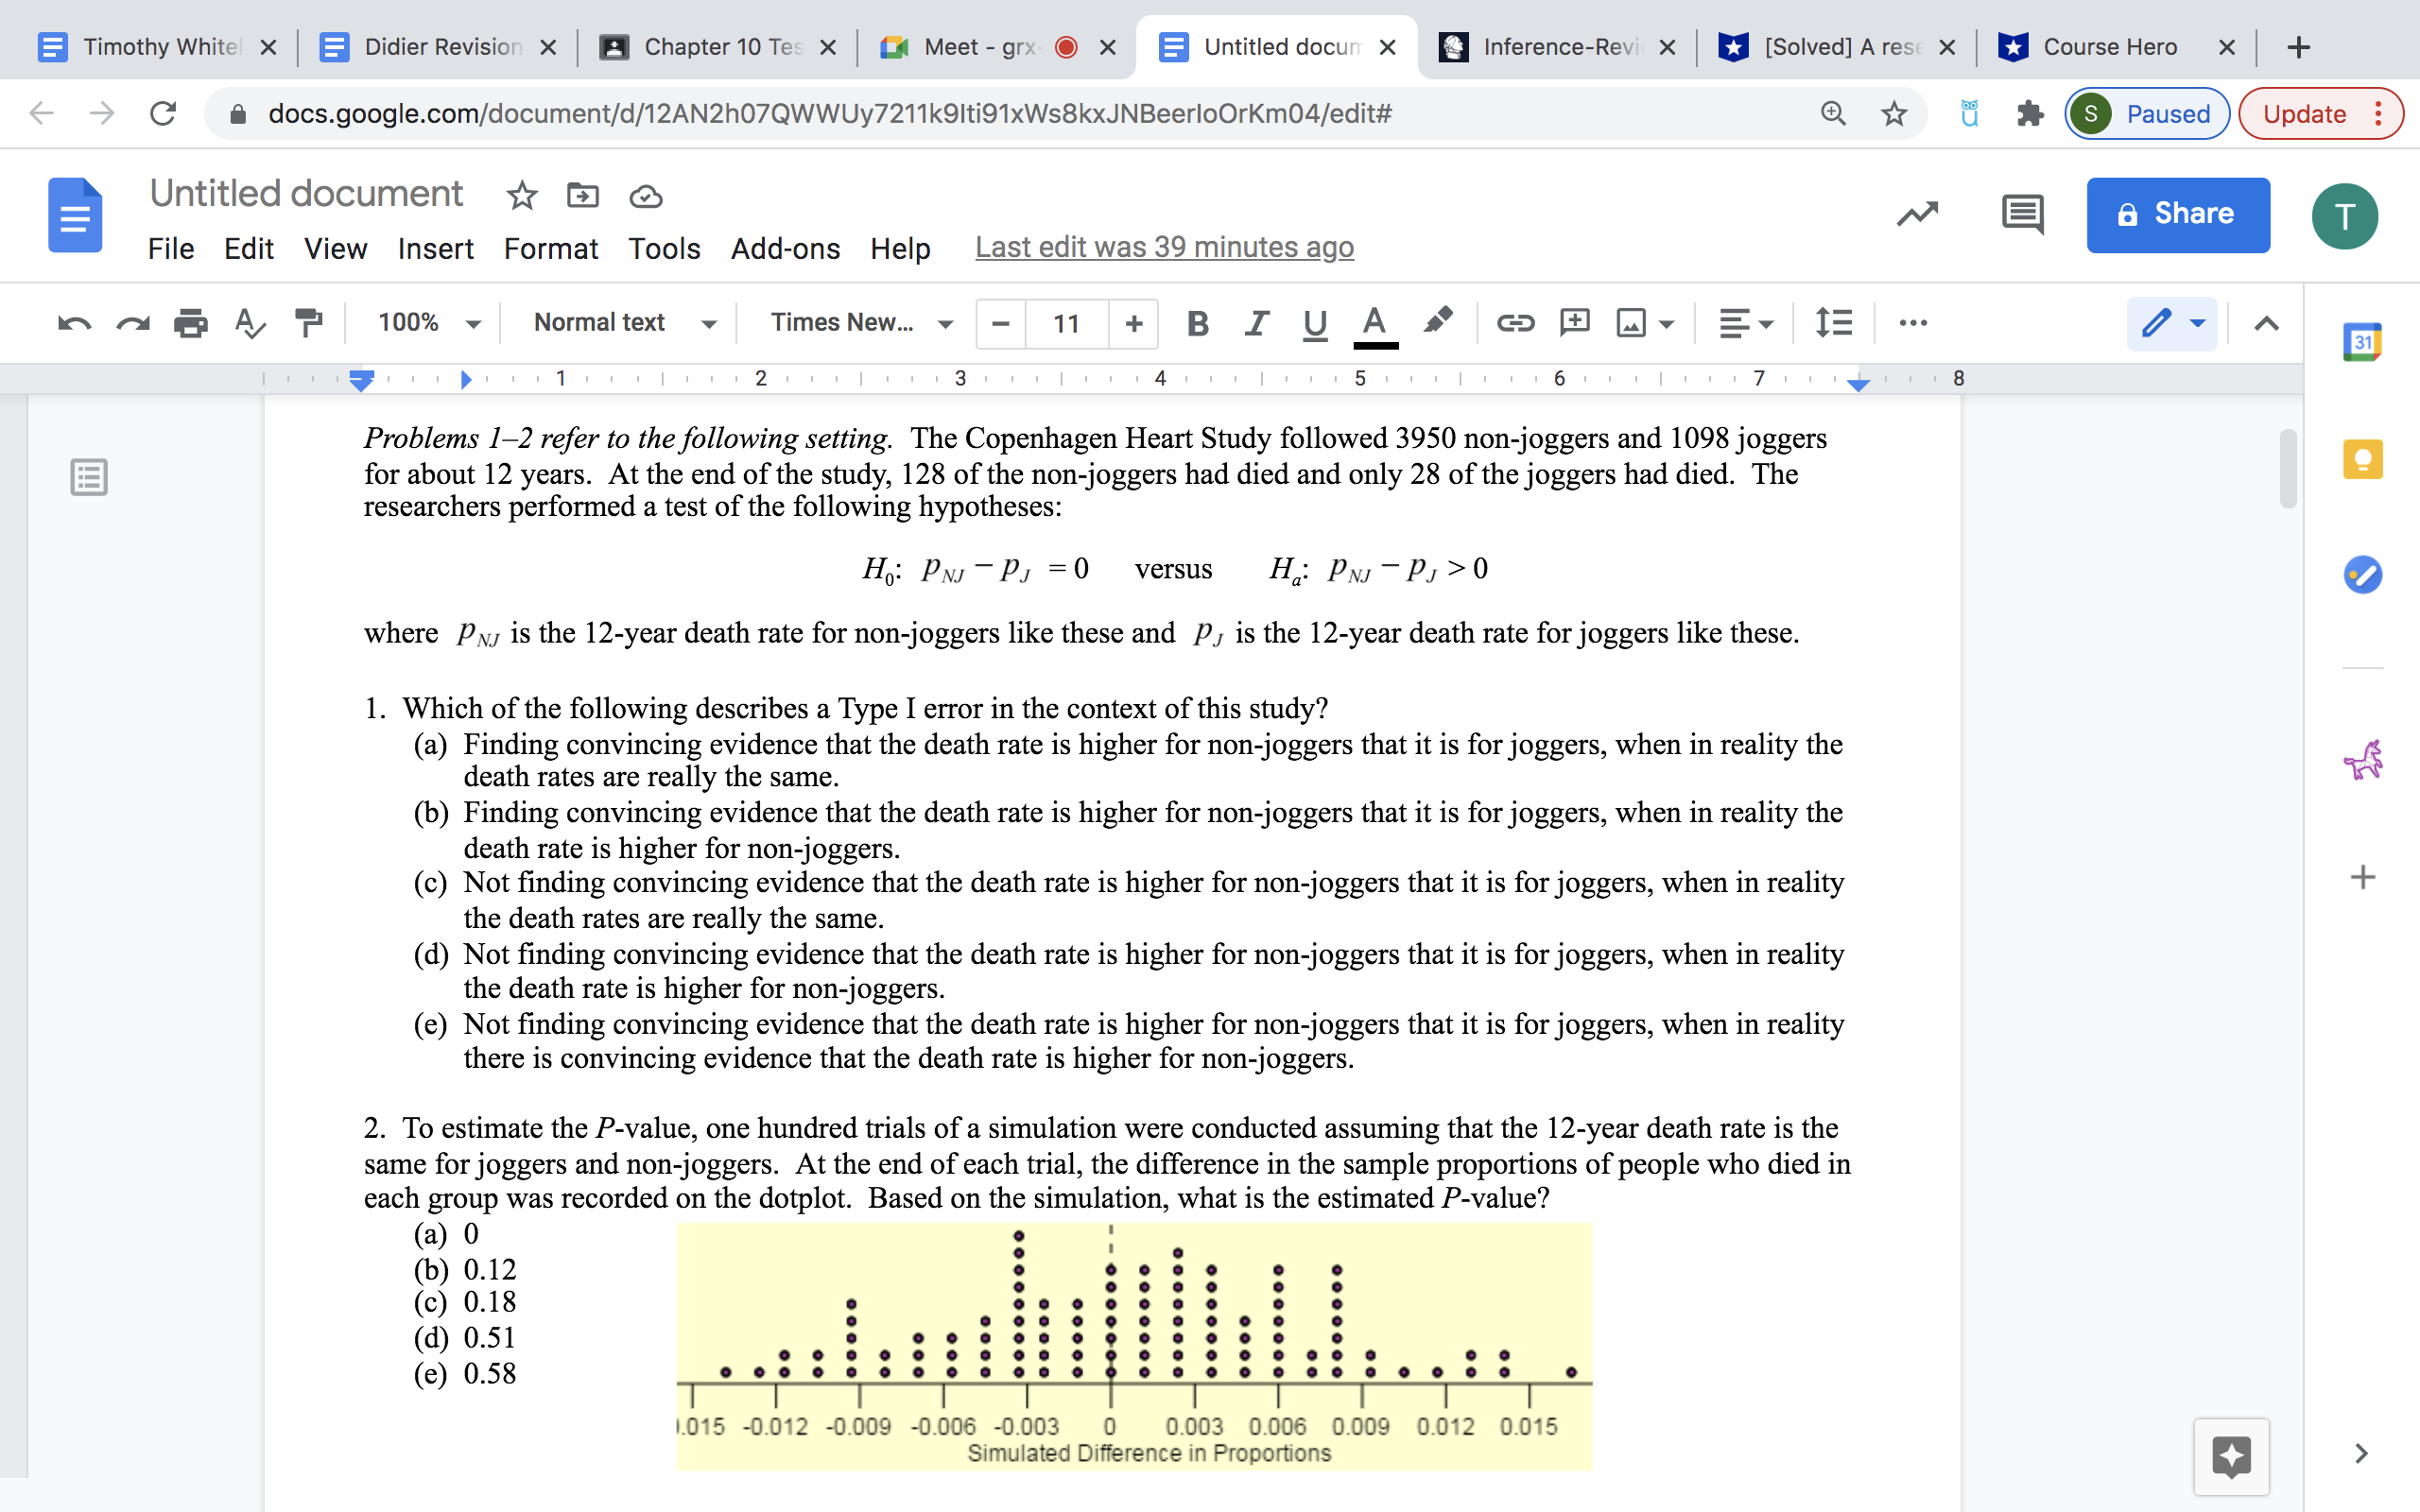
Timothy Whitel x _ Didier Revision X Chapter 10 Tes X Meet - grx O X Untitled docun X Inference-Revi X [Solved] A rest X Course Hero X + C a docs.google.com/document/d/12AN2h07QWWUy7211k9Iti91xWs8kxJNBeerloOrKm04/edit# S Paused Update : Untitled document * E 6 Share File Edit View Insert Format Tools Add-ons Help Last edit was 39 minutes ago 100% Normal text Times New... 11 + BIU A GO H - 1 ... 31 2 1 3 . 4 1 16 . . . 8 Problems 1-2 refer to the following setting. The Copenhagen Heart Study followed 3950 non-joggers and 1098 joggers for about 12 years. At the end of the study, 128 of the non-joggers had died and only 28 of the joggers had died. The researchers performed a test of the following hypotheses: Ho: PNJ - PJ = 0 versus Ha: PNJ - PJ > 0 where PAJ is the 12-year death rate for non-joggers like these and Py is the 12-year death rate for joggers like these. 1. Which of the following describes a Type I error in the context of this study? (a) Finding convincing evidence that the death rate is higher for non-joggers that it is for joggers, when in reality the death rates are really the same. b) Finding convincing evidence that the death rate is higher for non-joggers that it is for joggers, when in reality the death rate is higher for non-joggers. c) Not finding convincing evidence that the death rate is higher for non-joggers that it is for joggers, when in reality + the death rates are really the same. (d) Not finding convincing evidence that the death rate is higher for non-joggers that it is for joggers, when in reality the death rate is higher for non-joggers. (e) Not finding convincing evidence that the death rate is higher for non-joggers that it is for joggers, when in reality there is convincing evidence that the death rate is higher for non-joggers. 2. To estimate the P-value, one hundred trials of a simulation were conducted assuming that the 12-year death rate is the same for joggers and non-joggers. At the end of each trial, the difference in the sample proportions of people who died in each group was recorded on the dotplot. Based on the simulation, what is the estimated P-value? a) 0 (b) 0.12 c) 0.18 . . . . . d) 0.51 (e) 0.58 1.015 -0.012 -0.009 -0.006 -0.003 0 0.003 0.006 0.009 0.012 0.015 Simulated Difference in Proportions + >


