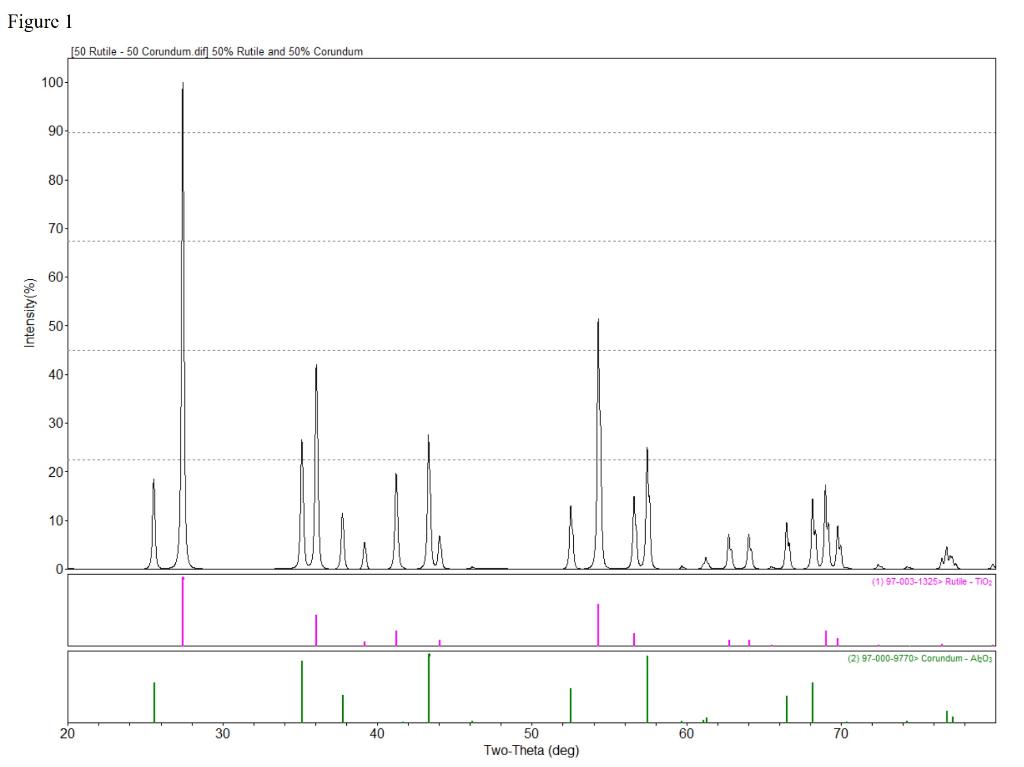
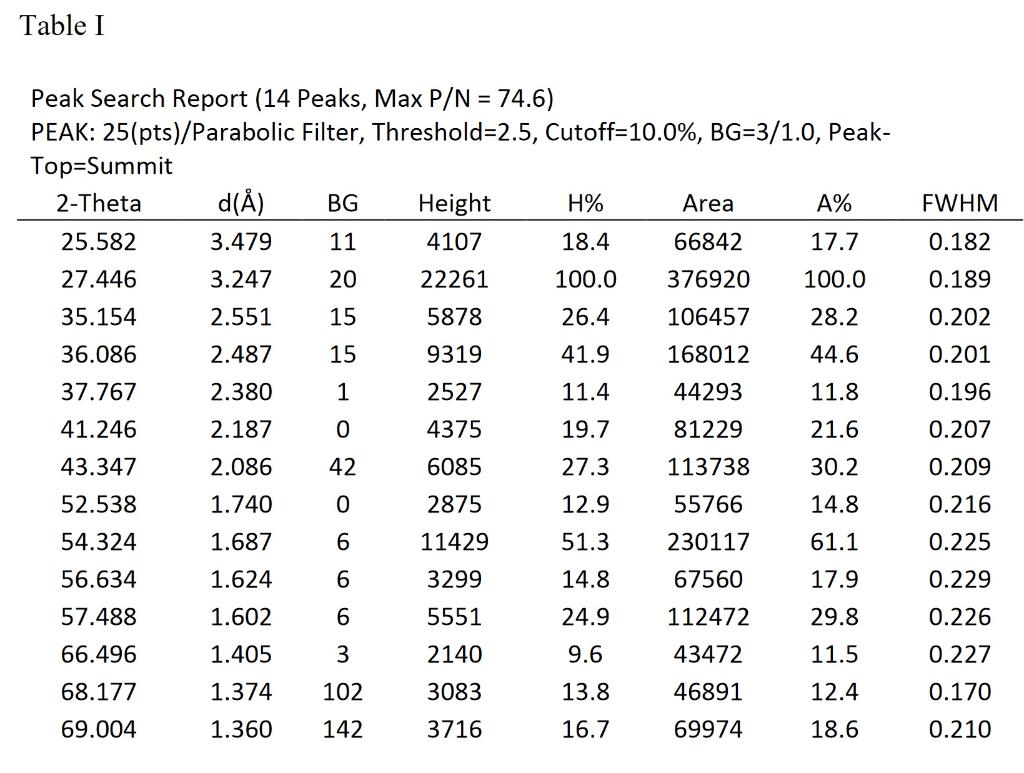
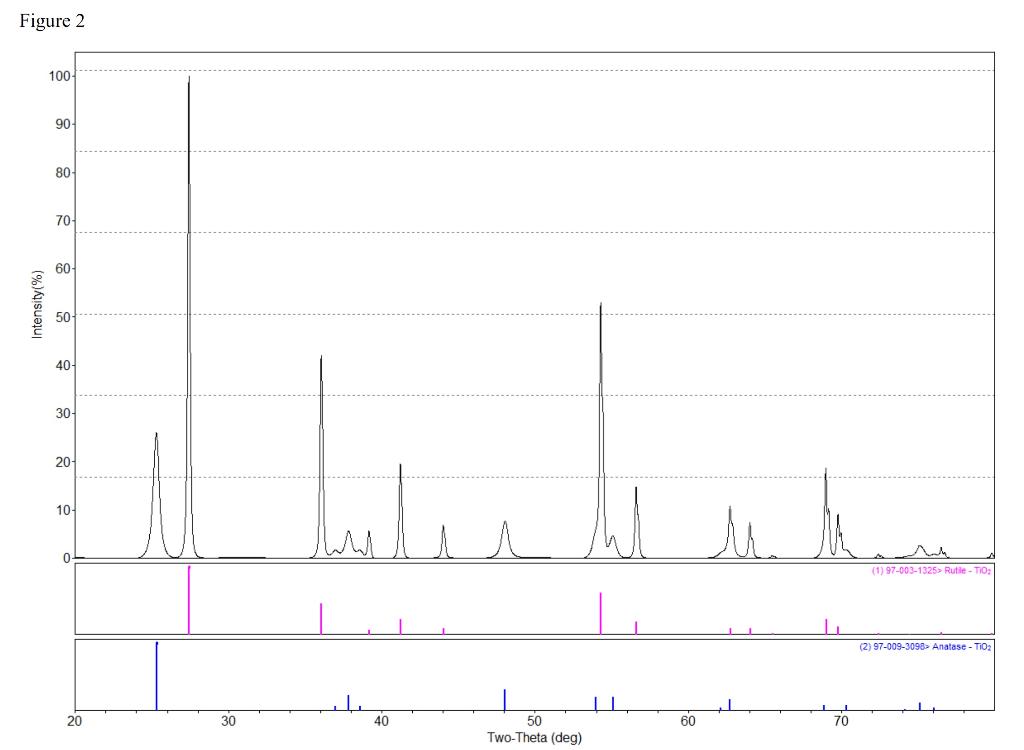
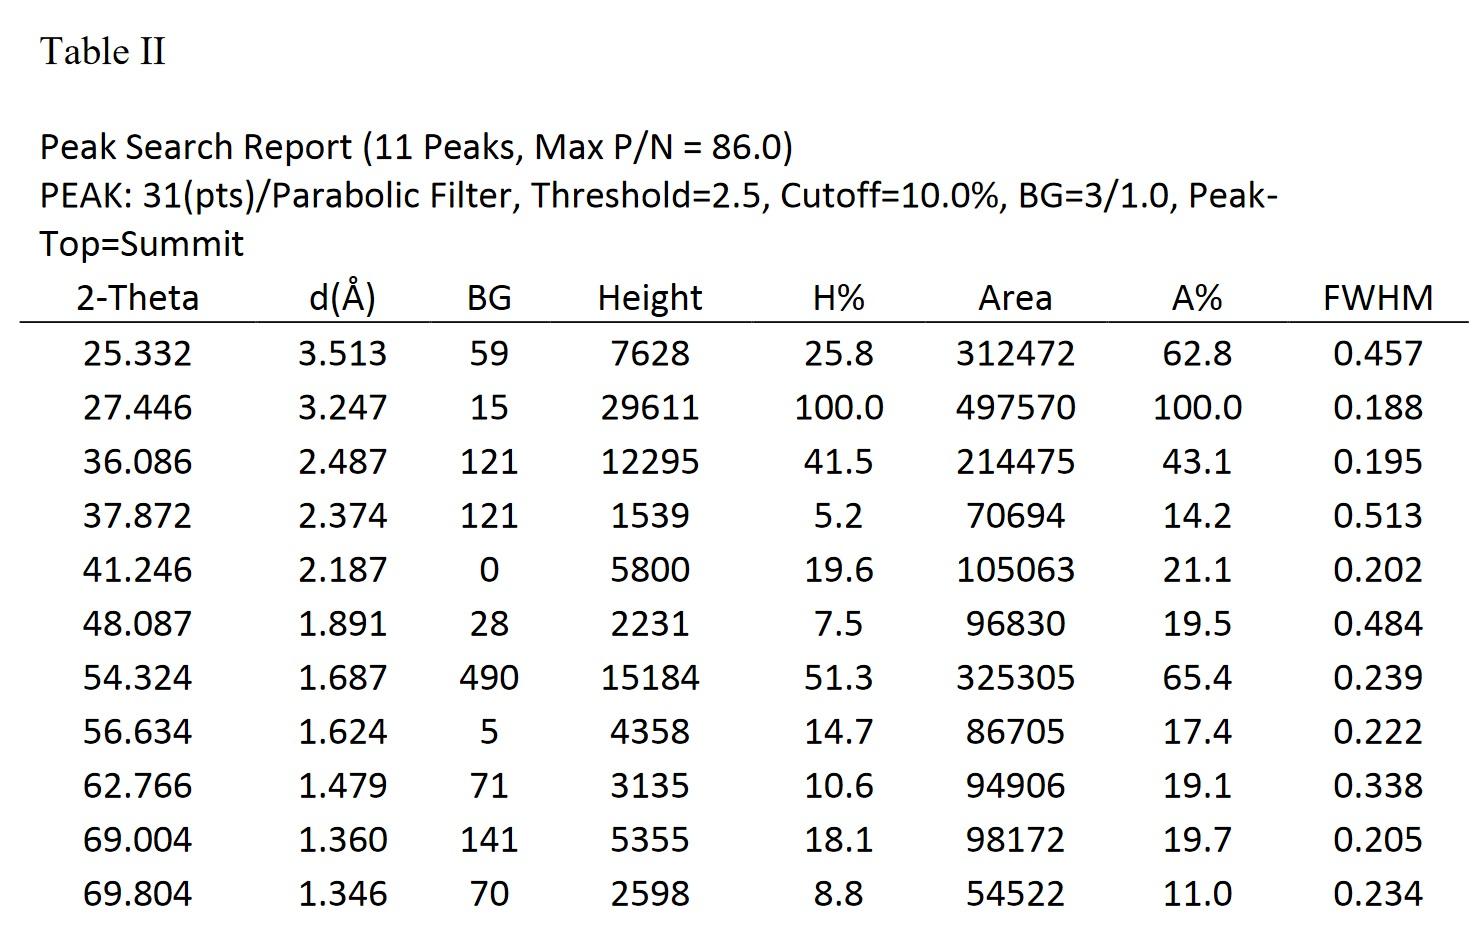
TiO2 is a compound with multiple polymorphs. The two most common polymorphs are Rutile and Anatase, which are found in pigments, makeup and many other products. a. Using Figure 1, calculate the RIR value for Rutile TiO2. I have included major peak information for Figure 1 in Table I. The sample in Figure 1 is 50% Rutile and 50% Corundum b. Using Figure 2, calculate the quantities of Anatase and Rutile from this pattern. The RIR for Anatase TiO2 is ~4.7. I have included major peak information for Figure 2 in Table II. Why did you answer this the way you did? c. Estimate the crystallite size for Anatase and Rutile using the strongest reflections for each.


Figure 1 [50 Rutile - 50 Corundum dif] 50% Rutile and 50% Corundum 100 90 80 70- 60 Intensity(%) 50 40 30 20 10 0 (1) 97-003-1325> Rutile - T102 (2) 97-000-9770> Corundum-A03 20 30 40 60 70 50 Two-Theta (deg) Table 1 FWHM 0.182 0.189 0.202 0.201 0.196 Peak Search Report (14 Peaks, Max P/N = 74.6) PEAK: 25(pts)/Parabolic Filter, Threshold=2.5, Cutoff=10.0%, BG=3/1.0, Peak- Top=Summit 2-Theta d() BG Height H% Area A% 25.582 3.479 11 4107 18.4 66842 17.7 27.446 3.247 20 22261 100.0 376920 100.0 35.154 2.551 15 5878 26.4 106457 28.2 36.086 2.487 15 9319 41.9 168012 44.6 37.767 2.380 1 2527 11.4 44293 11.8 41.246 2.187 0 4375 19.7 81229 21.6 43.347 2.086 42 6085 27.3 113738 30.2 52.538 1.740 0 2875 12.9 55766 14.8 54.324 1.687 6 11429 51.3 230117 61.1 56.634 1.624 6 3299 14.8 67560 17.9 57.488 1.602 6 5551 24.9 112472 29.8 66.496 1.405 3 2140 9.6 43472 11.5 68.177 1.374 102 3083 13.8 46891 12.4 69.004 1.360 142 3716 16.7 69974 18.6 0.207 0.209 0.216 0.225 0.229 0.226 0.227 0.170 0.210 Figure 2 100 90 80 70 60 Intensity(%) 50 40 30 20 10 W u 0 (1) 97-003-1325> Rutile - TIO (2) 97-009-3098 Anatase - TIO 20 30 40 60 70 50 Two-Theta (deg) Table II FWHM 0.457 0.188 0.195 Peak Search Report (11 Peaks, Max P/N = 86.0) PEAK: 31(pts)/Parabolic Filter, Threshold=2.5, Cutoff=10.0%, BG=3/1.0, Peak- Top=Summit 2-Theta d(8) BG Height H% Area A% 25.332 3.513 59 7628 25.8 312472 62.8 27.446 3.247 15 29611 100.0 497570 100.0 36.086 2.487 121 12295 41.5 214475 43.1 37.872 2.374 121 1539 5.2 70694 14.2 41.246 2.187 0 5800 19.6 105063 21.1 48.087 1.891 28 2231 7.5 96830 19.5 54.324 1.687 490 15184 51.3 325305 65.4 56.634 1.624 5 4358 14.7 86705 17.4 62.766 1.479 71 3135 10.6 94906 19.1 69.004 1.360 141 5355 18.1 98172 19.7 69.804 1.346 70 2598 8.8 54522 11.0 0.513 0.202 0.484 0.239 0.222 0.338 0.205 0.234 Figure 1 [50 Rutile - 50 Corundum dif] 50% Rutile and 50% Corundum 100 90 80 70- 60 Intensity(%) 50 40 30 20 10 0 (1) 97-003-1325> Rutile - T102 (2) 97-000-9770> Corundum-A03 20 30 40 60 70 50 Two-Theta (deg) Table 1 FWHM 0.182 0.189 0.202 0.201 0.196 Peak Search Report (14 Peaks, Max P/N = 74.6) PEAK: 25(pts)/Parabolic Filter, Threshold=2.5, Cutoff=10.0%, BG=3/1.0, Peak- Top=Summit 2-Theta d() BG Height H% Area A% 25.582 3.479 11 4107 18.4 66842 17.7 27.446 3.247 20 22261 100.0 376920 100.0 35.154 2.551 15 5878 26.4 106457 28.2 36.086 2.487 15 9319 41.9 168012 44.6 37.767 2.380 1 2527 11.4 44293 11.8 41.246 2.187 0 4375 19.7 81229 21.6 43.347 2.086 42 6085 27.3 113738 30.2 52.538 1.740 0 2875 12.9 55766 14.8 54.324 1.687 6 11429 51.3 230117 61.1 56.634 1.624 6 3299 14.8 67560 17.9 57.488 1.602 6 5551 24.9 112472 29.8 66.496 1.405 3 2140 9.6 43472 11.5 68.177 1.374 102 3083 13.8 46891 12.4 69.004 1.360 142 3716 16.7 69974 18.6 0.207 0.209 0.216 0.225 0.229 0.226 0.227 0.170 0.210 Figure 2 100 90 80 70 60 Intensity(%) 50 40 30 20 10 W u 0 (1) 97-003-1325> Rutile - TIO (2) 97-009-3098 Anatase - TIO 20 30 40 60 70 50 Two-Theta (deg) Table II FWHM 0.457 0.188 0.195 Peak Search Report (11 Peaks, Max P/N = 86.0) PEAK: 31(pts)/Parabolic Filter, Threshold=2.5, Cutoff=10.0%, BG=3/1.0, Peak- Top=Summit 2-Theta d(8) BG Height H% Area A% 25.332 3.513 59 7628 25.8 312472 62.8 27.446 3.247 15 29611 100.0 497570 100.0 36.086 2.487 121 12295 41.5 214475 43.1 37.872 2.374 121 1539 5.2 70694 14.2 41.246 2.187 0 5800 19.6 105063 21.1 48.087 1.891 28 2231 7.5 96830 19.5 54.324 1.687 490 15184 51.3 325305 65.4 56.634 1.624 5 4358 14.7 86705 17.4 62.766 1.479 71 3135 10.6 94906 19.1 69.004 1.360 141 5355 18.1 98172 19.7 69.804 1.346 70 2598 8.8 54522 11.0 0.513 0.202 0.484 0.239 0.222 0.338 0.205 0.234


