Determination of the acceleration due to gravity using a simple pendulum Virtual Laboratory Session xperimental Set-u o Equipment required: Smart Phones / Computers connected


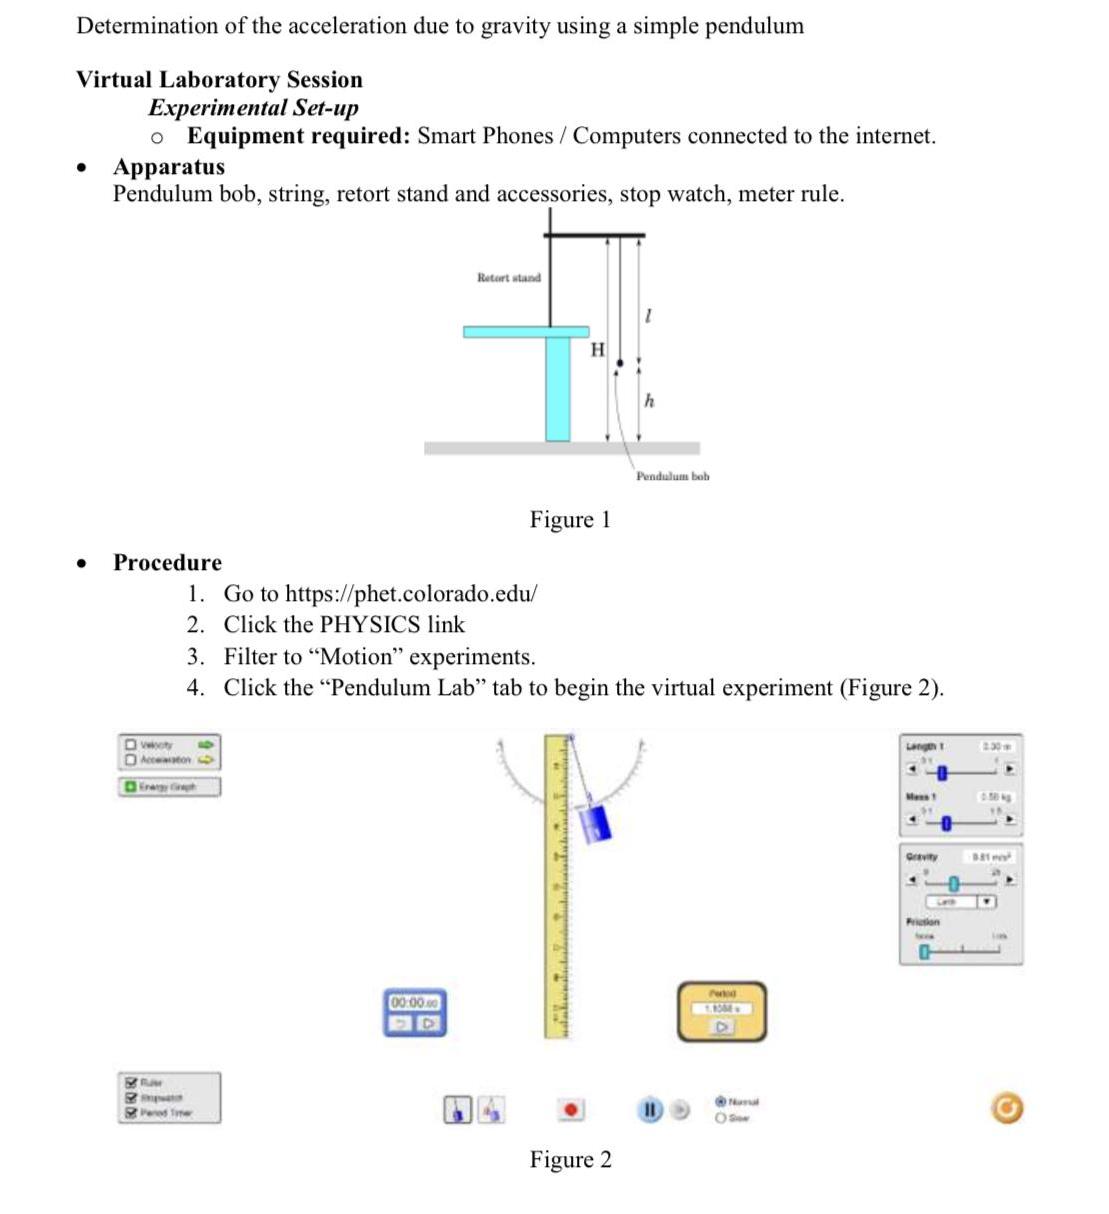
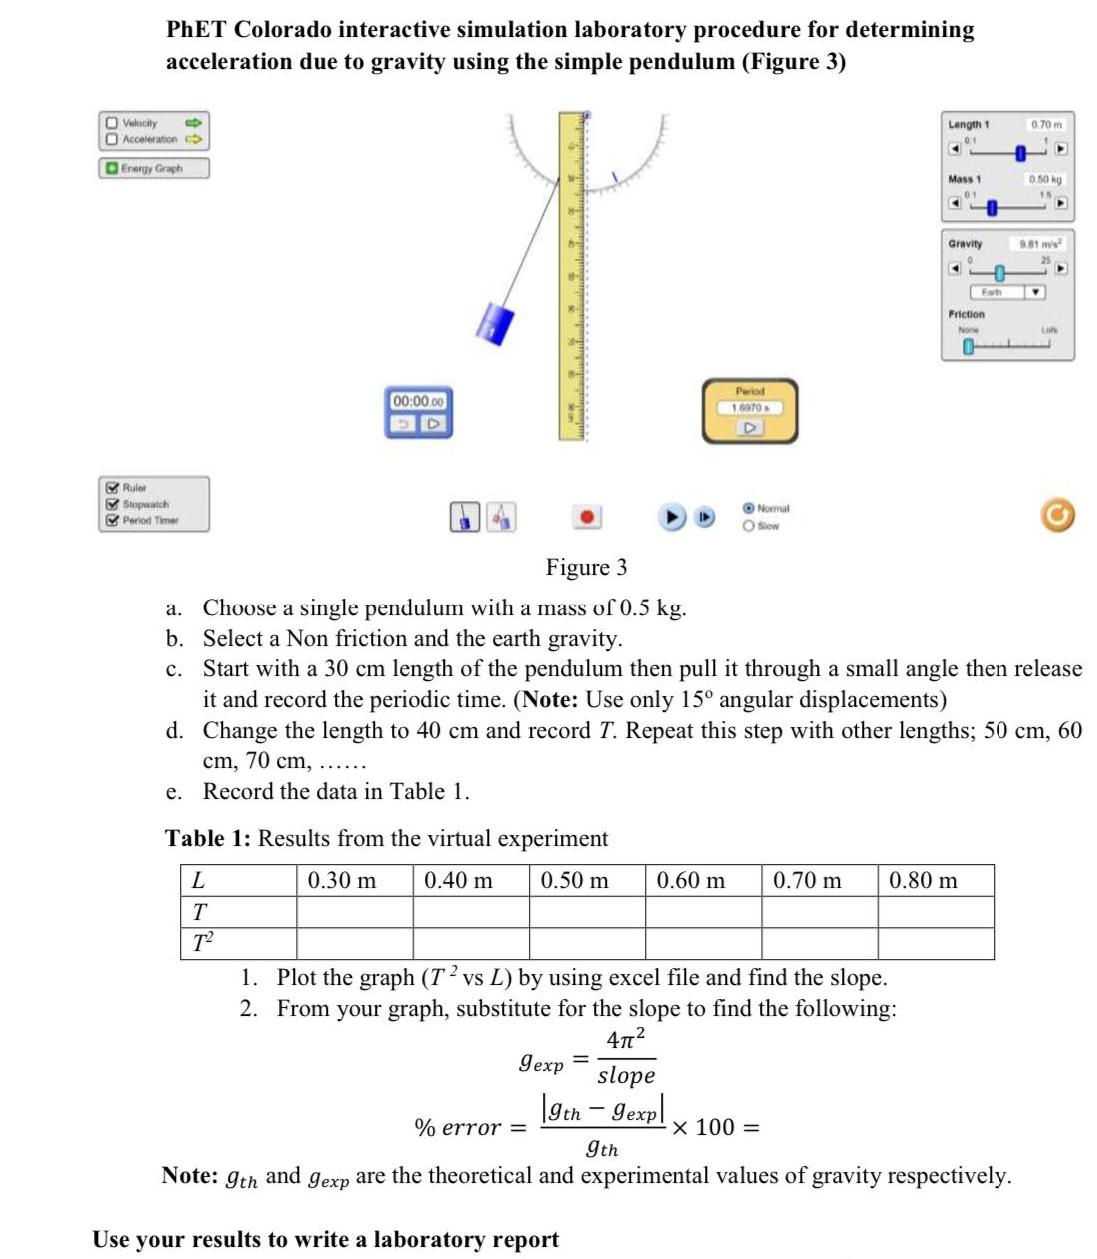
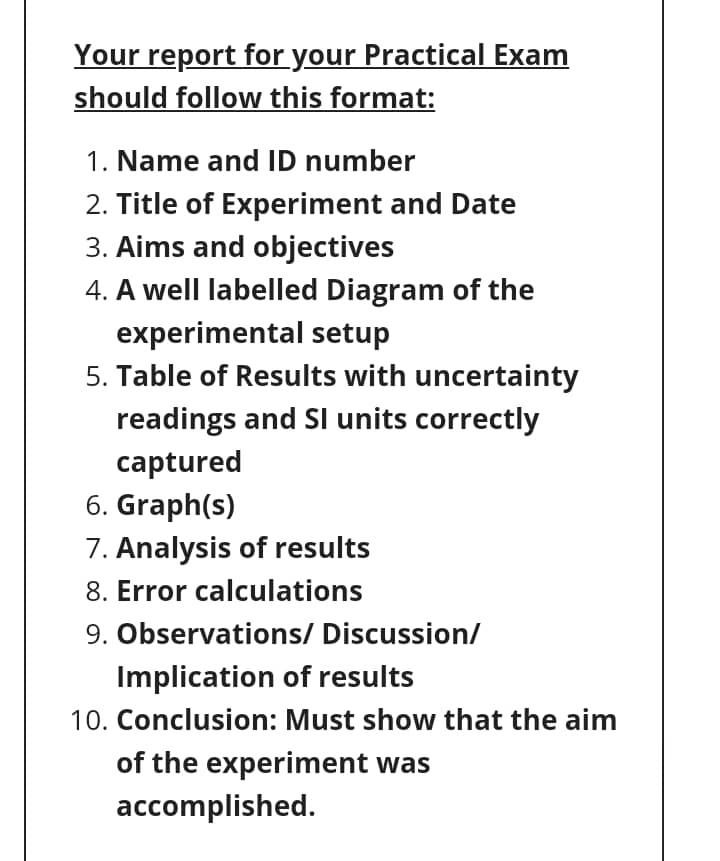
Determination of the acceleration due to gravity using a simple pendulum Virtual Laboratory Session xperimental Set-u o Equipment required: Smart Phones / Computers connected to the internet. Apparatus Pendulum bob, string, retort stand and accessories, stop watch, meter rule. Retort stand H. Pendulum bob Figure 1 Procedure 1. Go to https://phet.colorado.edu/ 2. Click the PHYSICS link 3. Filter to "Motion" experiments. 4. Click the "Pendulum Lab" tab to begin the virtual experiment (Figure 2). D voty O Aeceton Langh 1 2.30 Dir Mes Grevity Prion 00-000 Ped Tme Figure 2 PhET Colorado interactive simulation laboratory procedure for determining acceleration due to gravity using the simple pendulum (Figure 3) O Velocily O Accoleration Length 1 0.70 m 01 Energy Graph Mass 1 0.50 kg Gravity 9.81 ms Fah Friction None Period 00:00.00 D 16070 D & Ruler V Stopwatch O Normal E Period Timer O Siow Figure 3 a. Choose a single pendulum with a mass of 0.5 kg. b. Select a Non friction and the earth gravity. c. Start with a 30 cm length of the pendulum then pull it through a small angle then release it and record the periodic time. (Note: Use only 15 angular displacements) d. Change the length to 40 cm and record T. Repeat this step with other lengths; 50 cm, 60 cm, 70 cm, e. Record the data in Table 1. Table 1: Results from the virtual experiment L 0.30 m 0.40 m 0.50 m 0.60 m 0.70 m 0.80 m T T 1. Plot the graph (T2 vs L) by using excel file and find the slope. 2. From your graph, substitute for the slope to find the following: 472 Iexp = slope |gtn - gexpl % error = x 100 = 9th Note: 9th and gexp are the theoretical and experimental values of gravity respectively. Use your results to write a laboratory report Your report for your Practical Exam should follow this format: 1. Name and ID number 2. Title of Experiment and Date 3. Aims and objectives 4. A well labelled Diagram of the experimental setup 5. Table of Results with uncertainty readings and SI units correctly captured 6. Graph(s) 7. Analysis of results 8. Error calculations 9. Observations/ Discussion/ Implication of results 10. Conclusion: Must show that the aim of the experiment was accomplished.
Step by Step Solution
3.32 Rating (158 Votes )
There are 3 Steps involved in it
Step: 1

See step-by-step solutions with expert insights and AI powered tools for academic success
Step: 2

Step: 3

Ace Your Homework with AI
Get the answers you need in no time with our AI-driven, step-by-step assistance
Get Started


