Question
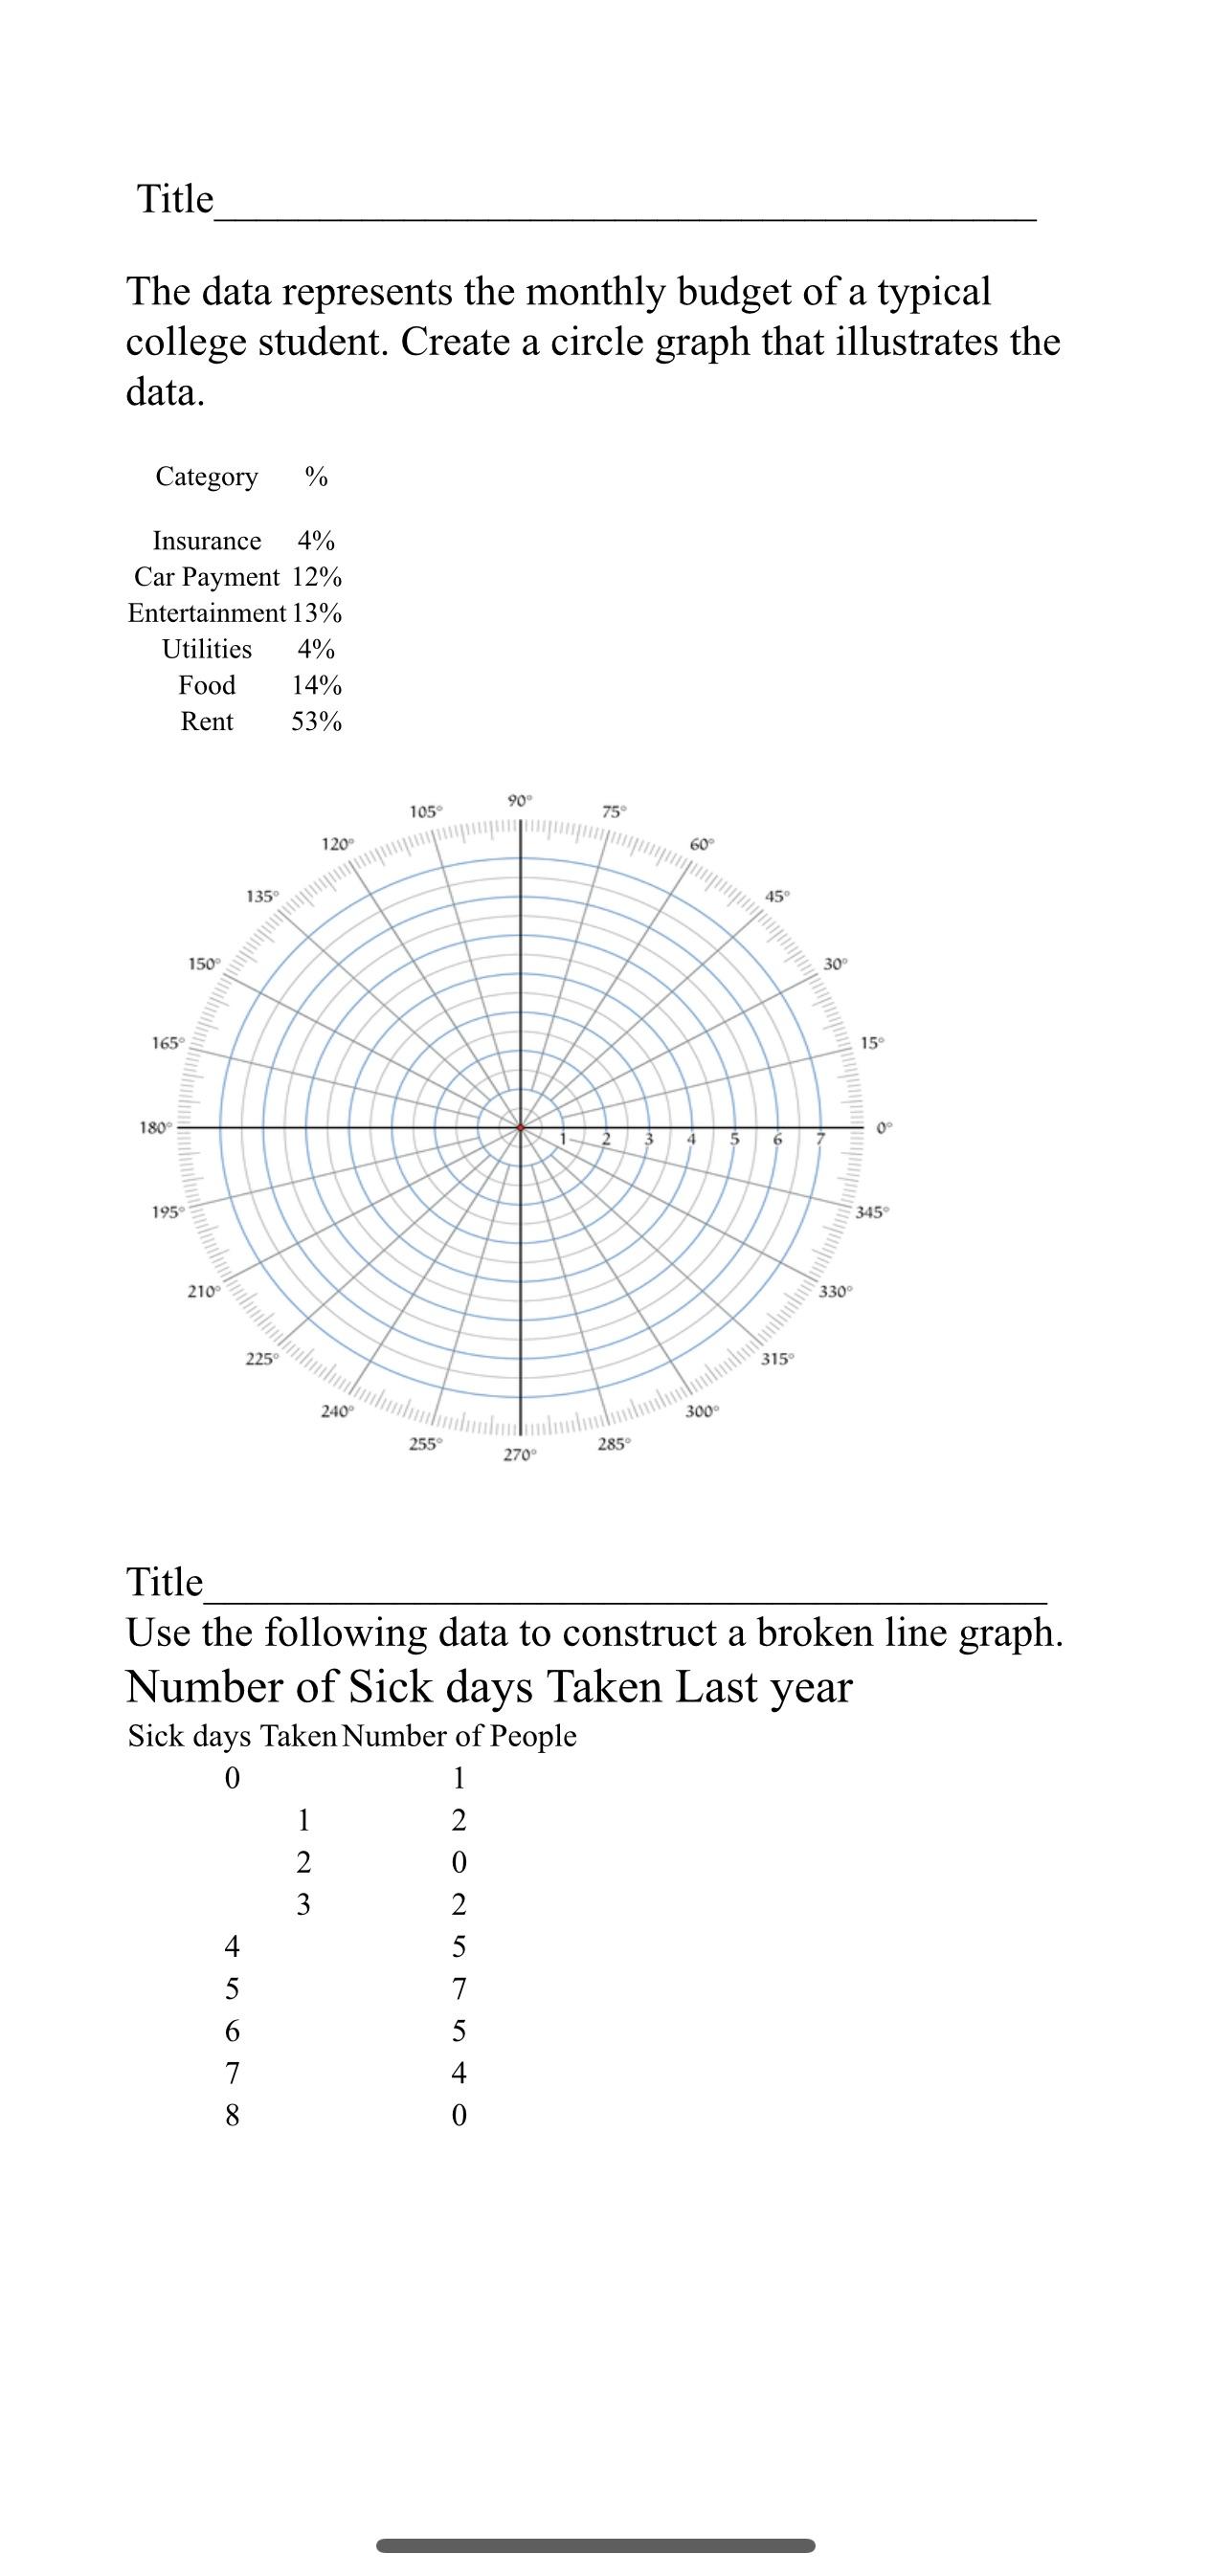
Title The data represents the monthly budget of a typical college student. Create a circle graph that illustrates the data. Category % Insurance 4%

Title The data represents the monthly budget of a typical college student. Create a circle graph that illustrates the data. Category % Insurance 4% Car Payment 12% Entertainment 13% Utilities 4% Food 14% Rent 53% 165 180 195 150 210 135 4 5 6 7 8 225 120 1 2 3 240 105 255 ONSTSTO 0 2 5 7 5 4 90 0 270 75 285 60 Title Use the following data to construct a broken line graph. Number of Sick days Taken Last year Sick days Taken Number of People 0 1 2 4 300 5 45 315 30 330 15 345
Step by Step Solution
There are 3 Steps involved in it
Step: 1

Get Instant Access to Expert-Tailored Solutions
See step-by-step solutions with expert insights and AI powered tools for academic success
Step: 2

Step: 3

Ace Your Homework with AI
Get the answers you need in no time with our AI-driven, step-by-step assistance
Get StartedRecommended Textbook for
Financial Algebra advanced algebra with financial applications
Authors: Robert K. Gerver
1st edition
978-1285444857, 128544485X, 978-0357229101, 035722910X, 978-0538449670
Students also viewed these Databases questions
Question
Answered: 1 week ago
Question
Answered: 1 week ago
Question
Answered: 1 week ago
Question
Answered: 1 week ago
Question
Answered: 1 week ago
Question
Answered: 1 week ago
Question
Answered: 1 week ago
Question
Answered: 1 week ago
Question
Answered: 1 week ago
Question
Answered: 1 week ago
Question
Answered: 1 week ago
Question
Answered: 1 week ago
Question
Answered: 1 week ago
Question
Answered: 1 week ago
Question
Answered: 1 week ago
Question
Answered: 1 week ago
Question
Answered: 1 week ago
Question
Answered: 1 week ago
Question
Answered: 1 week ago
Question
Answered: 1 week ago
View Answer in SolutionInn App


