Question
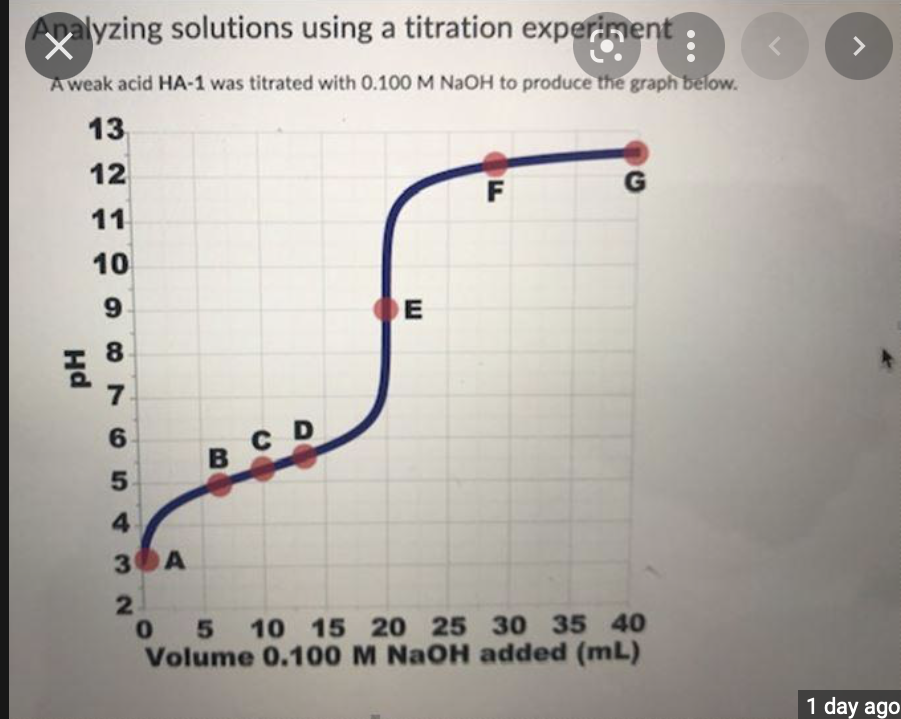
To answer this question, refer to the titration curve shown above and the points labelled A-G . Which of the following statements correctly describe the

To answer this question, refer to the titration curve shown above and the points labelled A-G.
Which of the following statements correctly describe the content of the solution being titrated at the different points during the titration?
Select all that apply. There is a penalty for each missed or incorrect selection.
Question 2 options:
|
| At point A, there are more H3O+ ions than any other species present in solution (apart from water). |
|
| At point B, the solution in the beaker could be described as a buffer solution. |
|
| At point C, the concentration of H3O+ ions in the solution is equal to the Kavalue of the acid being titration. |
|
| At point D, there are equal amounts of A ions and HA molecules in solution. |
|
| At point E, the concentration of H3O+ ions is the same as the concentration of OH ions. |
|
| At points F and G, the number of A ions in solution is approximately the same. |
|
| At points F and G, the concentration of A ions in solution is approximately the same. |
Question 3 (2 points)
In Question 2, you analyzed a titration curve for a weak acid "HA-1".
Now, let's imagine what the titration curve of a different acid "HA-2" would look like.
Assume that this other acid has the same initial concentration as the "HA-1" solution but that it has a different Ka value:
Ka HA-2 = 7.7 x 10⁻⁷
Also assume that you start your titration experiment using the same volume of acid solution and using the same NaOH solution to titrate.
Determine whether the following values are expected to be larger, lower, or the same.
Question 3 options:
|
|
Step by Step Solution
There are 3 Steps involved in it
Step: 1

Get Instant Access to Expert-Tailored Solutions
See step-by-step solutions with expert insights and AI powered tools for academic success
Step: 2

Step: 3

Ace Your Homework with AI
Get the answers you need in no time with our AI-driven, step-by-step assistance
Get Started


