

Answered step by step
Verified Expert Solution
Question
1 Approved Answer
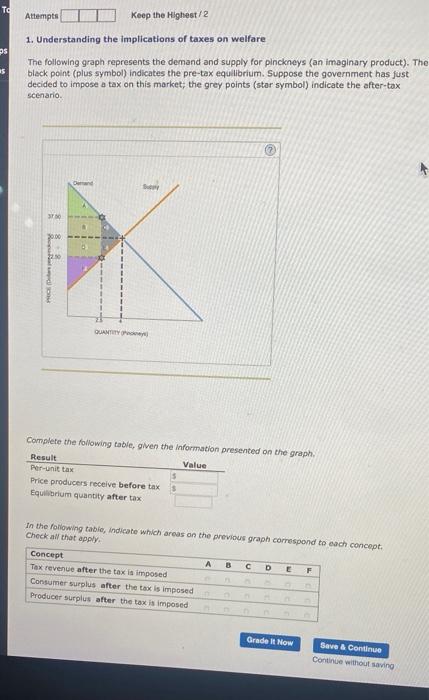
To Attempts Keep the Highest/2 1. Understanding the implications of taxes on welfare S 25 The following graph represents the demand and supply for pinckneys
Step by Step Solution
There are 3 Steps involved in it
Step: 1

Get Instant Access to Expert-Tailored Solutions
See step-by-step solutions with expert insights and AI powered tools for academic success
Step: 2

Step: 3
Ace Your Homework with AI
Get the answers you need in no time with our AI-driven, step-by-step assistance
Get Started
Auditing Concepts And Methods A Guide To Current Auditing Theory And Practice
Authors: Mcgraw-Hill
5th Edition
0070099995, 978-0070099999