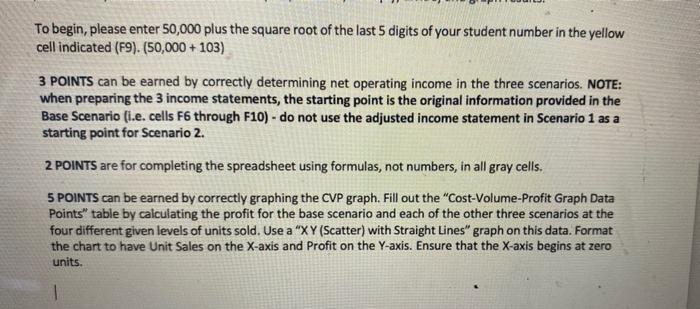
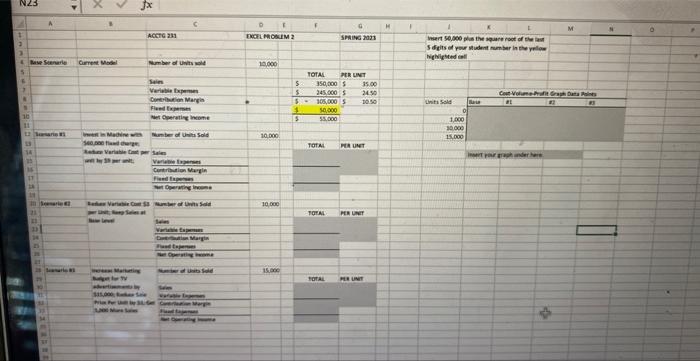
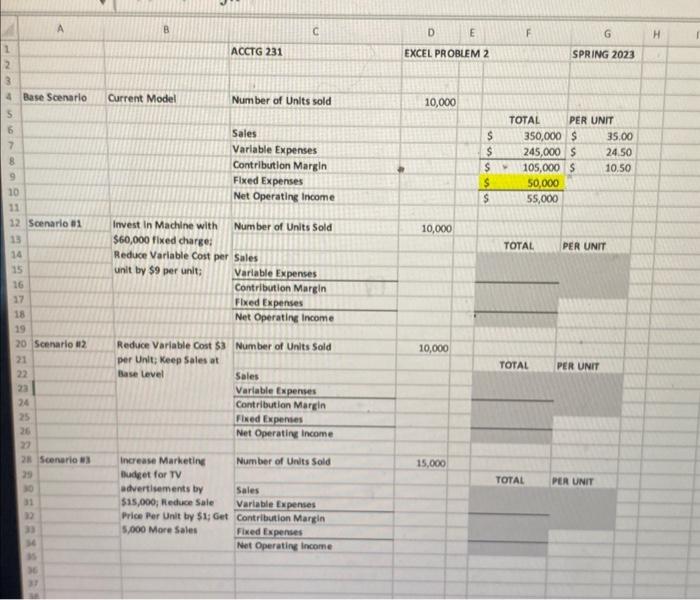
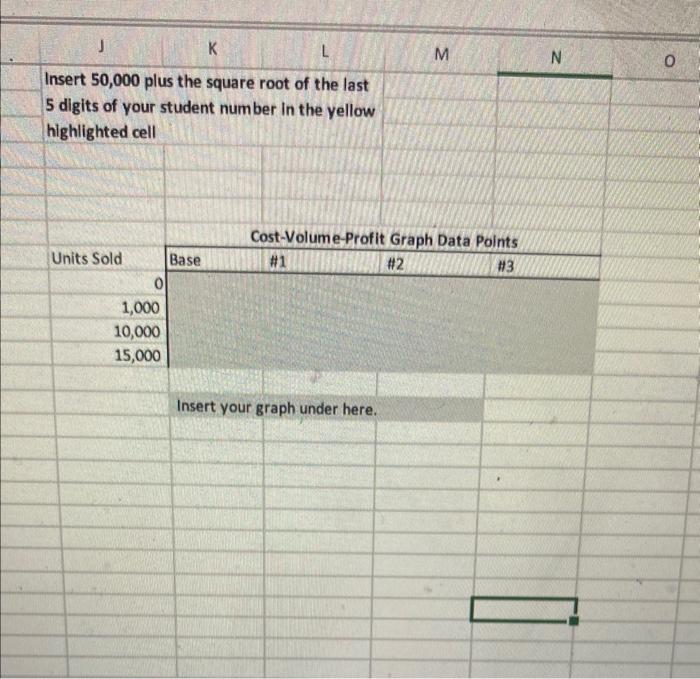
To begin, please enter 50,000 plus the square root of the last 5 digits of your student number in the yellow cell indicated (F9)(50,000+103) 3 POINTS can be earned by correctly determining net operating income in the three scenarios. NOTE: when preparing the 3 income statements, the starting point is the original information provided in the Base Scenario (i.e. cells F6 through F10 ) - do not use the adjusted income statement in Scenario 1 as a starting point for Scenario 2. 2 POINTS are for completing the spreadsheet using formulas, not numbers, in all gray cells. 5 POINTS can be earned by correctly graphing the CVP graph. Fill out the "Cost-Volume-Profit Graph Data Points" table by calculating the profit for the base scenario and each of the other three scenarios at the four different given levels of units sold. Use a "XY (Scatter) with Straight Lines" graph on this data. Format the chart to have Unit Sales on the X-axis and Profit on the Y-axis. Ensure that the X-axis begins at zero units. Insert 50,000 plus the square root of the last 5 digits of your student number in the yellow highlighted cell \begin{tabular}{|r|r|r|c|} \multicolumn{1}{|c|}{ Units Sold } & \multicolumn{2}{c|}{ Cost-Volume-Profit Graph Data Points } \\ \cline { 2 - 4 } \multicolumn{1}{|c|}{ Base } & \multicolumn{1}{|c|}{ \#1 } \\ \hline 1,000 & & & H3 \\ 10,000 & & & \\ 15,000 & & & \end{tabular} Insert your graph under here. To begin, please enter 50,000 plus the square root of the last 5 digits of your student number in the yellow cell indicated (F9)(50,000+103) 3 POINTS can be earned by correctly determining net operating income in the three scenarios. NOTE: when preparing the 3 income statements, the starting point is the original information provided in the Base Scenario (i.e. cells F6 through F10 ) - do not use the adjusted income statement in Scenario 1 as a starting point for Scenario 2. 2 POINTS are for completing the spreadsheet using formulas, not numbers, in all gray cells. 5 POINTS can be earned by correctly graphing the CVP graph. Fill out the "Cost-Volume-Profit Graph Data Points" table by calculating the profit for the base scenario and each of the other three scenarios at the four different given levels of units sold. Use a "XY (Scatter) with Straight Lines" graph on this data. Format the chart to have Unit Sales on the X-axis and Profit on the Y-axis. Ensure that the X-axis begins at zero units. Insert 50,000 plus the square root of the last 5 digits of your student number in the yellow highlighted cell \begin{tabular}{|r|r|r|c|} \multicolumn{1}{|c|}{ Units Sold } & \multicolumn{2}{c|}{ Cost-Volume-Profit Graph Data Points } \\ \cline { 2 - 4 } \multicolumn{1}{|c|}{ Base } & \multicolumn{1}{|c|}{ \#1 } \\ \hline 1,000 & & & H3 \\ 10,000 & & & \\ 15,000 & & & \end{tabular} Insert your graph under here