Question
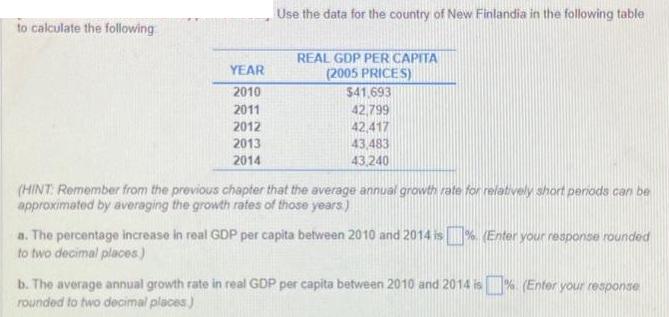
to calculate the following YEAR 2010 2011 2012 2013 2014 Use the data for the country of New Finlandia in the following table REAL

to calculate the following YEAR 2010 2011 2012 2013 2014 Use the data for the country of New Finlandia in the following table REAL GDP PER CAPITA (2005 PRICES) $41,693 42,799 42,417 43,483 43,240 (HINT: Remember from the previous chapter that the average annual growth rate for relatively short periods can be approximated by averaging the growth rates of those years) a. The percentage increase in real GDP per capita between 2010 and 2014 is % (Enter your response rounded to two decimal places) b. The average annual growth rate in real GDP per capita between 2010 and 2014 is % (Enter your response rounded to two decimal places)
Step by Step Solution
3.35 Rating (170 Votes )
There are 3 Steps involved in it
Step: 1
a Real GDP per Capita in 2010 41693 Real GDP per Capita in 2014 43240 Increase in GDP ...
Get Instant Access to Expert-Tailored Solutions
See step-by-step solutions with expert insights and AI powered tools for academic success
Step: 2

Step: 3

Ace Your Homework with AI
Get the answers you need in no time with our AI-driven, step-by-step assistance
Get StartedRecommended Textbook for
Macroeconomics
Authors: Stephen d. Williamson
5th Canadian edition
133847144, 9780134604794 , 978-0133847147
Students also viewed these Economics questions
Question
Answered: 1 week ago
Question
Answered: 1 week ago
Question
Answered: 1 week ago
Question
Answered: 1 week ago
Question
Answered: 1 week ago
Question
Answered: 1 week ago
Question
Answered: 1 week ago
Question
Answered: 1 week ago
Question
Answered: 1 week ago
Question
Answered: 1 week ago
Question
Answered: 1 week ago
Question
Answered: 1 week ago
Question
Answered: 1 week ago
Question
Answered: 1 week ago
Question
Answered: 1 week ago
Question
Answered: 1 week ago
Question
Answered: 1 week ago
Question
Answered: 1 week ago
Question
Answered: 1 week ago
Question
Answered: 1 week ago
Question
Answered: 1 week ago
View Answer in SolutionInn App


