

Question
To get a sense for how frequently each possible value occurs, it is useful to look at the histogram, normalized by the number of trials.
To get a sense for how frequently each possible value occurs, it is useful to look at the histogram, normalized by the number of trials. The code framework below2 generates a bar plot of the number of occurrences of each value from 0 to n, normalized by the number of trials. Your job is to fill in the lines of code needed to count the number of occurrences of the values i in the sequence X and also calculate the PMF of a Binomial(n, p) random variable for X = i. Then, for n = 10 and p = 1/2, generate and turn in plots for 100, 1000, and 10000 trials to get a sense for how the histogram converges to the true PMF.
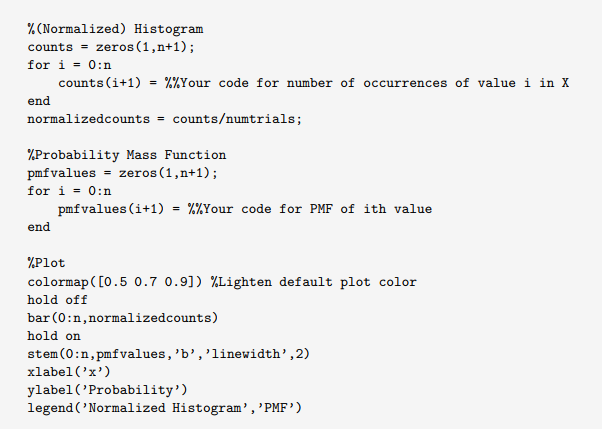
%(Normalized) Histogram counts zeros (1,n+1); for i 0:n counts(1+1) = %%Your code for number of occurrences of value i in X end normalizedcounts countsumtrials %Probability Mass Function pmfvalues-zeros (1,n+1) for i = 0:n pmfvalues (1+1) = %%Your code for PMF of ith value end Plot colormap ([0.5 0.7 0.91) %Lighten default plot color hold off bar (0:n,normalizedcounts) hold on stem(0:n,pmfvalues, 'b', 'linewidth',2) xlabel('x') ylabel('Probability') legend 'Normalized Histogram' , 'PMF')
Step by Step Solution
There are 3 Steps involved in it
Step: 1

Get Instant Access to Expert-Tailored Solutions
See step-by-step solutions with expert insights and AI powered tools for academic success
Step: 2

Step: 3
Ace Your Homework with AI
Get the answers you need in no time with our AI-driven, step-by-step assistance
Get Started
Database And Expert Systems Applications 23rd International Conference Dexa 2012 Vienna Austria September 2012 Proceedings Part 1 Lncs 7446
Authors: Stephen W. Liddle ,Klaus-Dieter Schewe ,A Min Tjoa ,Xiaofang Zhou
2012th Edition
3642325998, 978-3642325991