Answered step by step
Verified Expert Solution
Question
1 Approved Answer
To illustrate different data levels using small graphics representing values, which of the following can you use? q , icon sets Highlight Cells Rules data
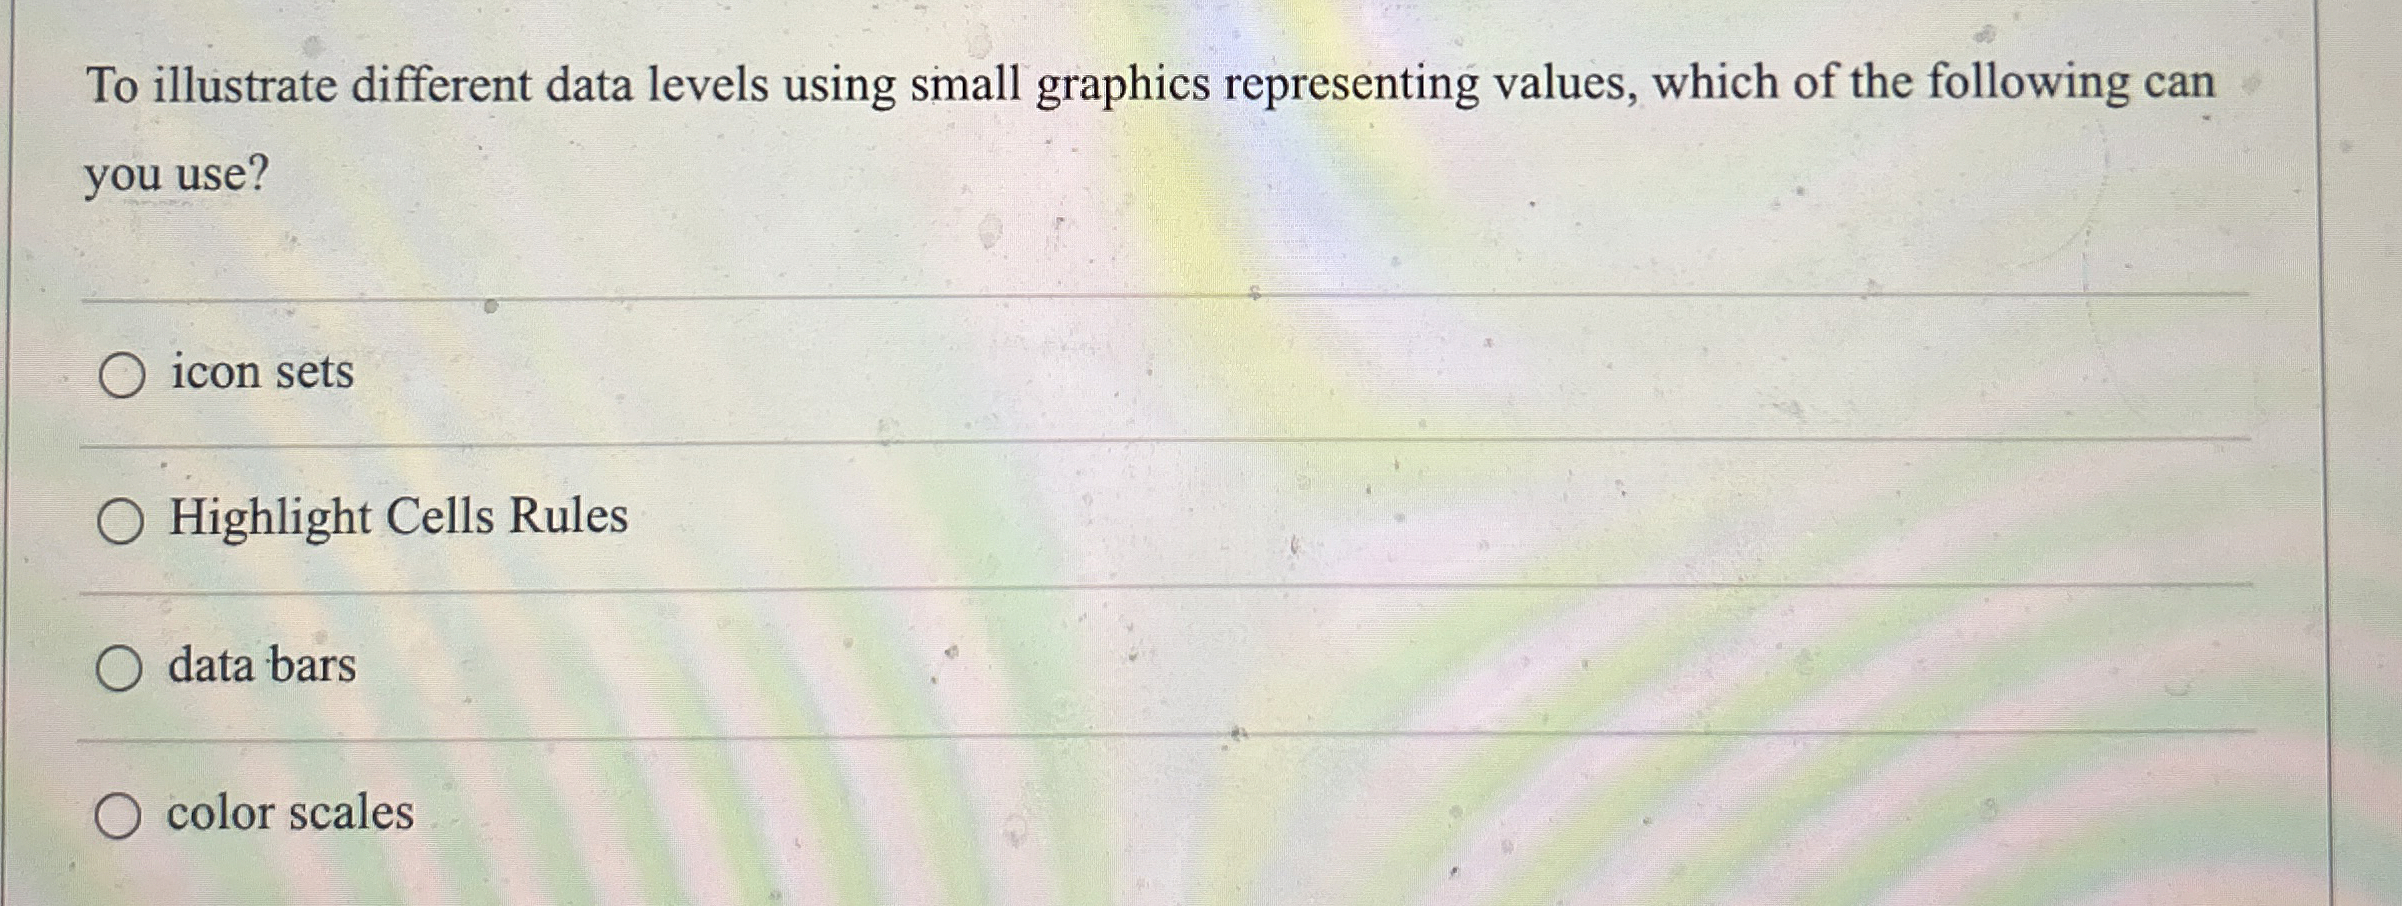
To illustrate different data levels using small graphics representing values, which of the following can you use?
icon sets
Highlight Cells Rules
data bars
color scales
Step by Step Solution
There are 3 Steps involved in it
Step: 1

Get Instant Access to Expert-Tailored Solutions
See step-by-step solutions with expert insights and AI powered tools for academic success
Step: 2

Step: 3
Ace Your Homework with AI
Get the answers you need in no time with our AI-driven, step-by-step assistance
Get Started