Question
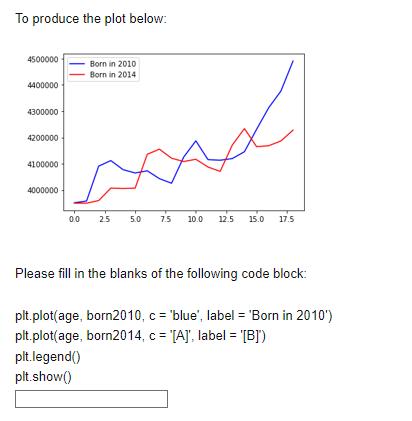
To produce the plot below: 4500000 Born in 2010 Born in 2014 4400000 4300000 4200000 4100000 4000000 0.0 25 5.0 7.5 10.0 12.5 15.0

To produce the plot below: 4500000 Born in 2010 Born in 2014 4400000 4300000 4200000 4100000 4000000 0.0 25 5.0 7.5 10.0 12.5 15.0 17.5 Please fill in the blanks of the following code block: plt.plot(age, born 2010, c = 'blue', label = 'Born in 2010') plt.plot(age, born 2014, c = [A]', label='[B]') plt.legend() plt.show()
Step by Step Solution
There are 3 Steps involved in it
Step: 1
Here are the appropriate values to fill in th...
Get Instant Access to Expert-Tailored Solutions
See step-by-step solutions with expert insights and AI powered tools for academic success
Step: 2

Step: 3

Ace Your Homework with AI
Get the answers you need in no time with our AI-driven, step-by-step assistance
Get StartedRecommended Textbook for
Principles Of Econometrics
Authors: R Carter Hill, William E Griffiths, Guay C Lim
5th Edition
1118452275, 9781118452271
Students also viewed these Programming questions
Question
Answered: 1 week ago
Question
Answered: 1 week ago
Question
Answered: 1 week ago
Question
Answered: 1 week ago
Question
Answered: 1 week ago
Question
Answered: 1 week ago
Question
Answered: 1 week ago
Question
Answered: 1 week ago
Question
Answered: 1 week ago
Question
Answered: 1 week ago
Question
Answered: 1 week ago
Question
Answered: 1 week ago
Question
Answered: 1 week ago
Question
Answered: 1 week ago
Question
Answered: 1 week ago
Question
Answered: 1 week ago
Question
Answered: 1 week ago
Question
Answered: 1 week ago
Question
Answered: 1 week ago
Question
Answered: 1 week ago
Question
Answered: 1 week ago
View Answer in SolutionInn App


