

14. Measuring over Time A quantitative variable is measured once a year for a 10-year period. What...
Question:
14. Measuring over Time A quantitative variable is measured once a year for a 10-year period. What does the line chart tell you about the data?
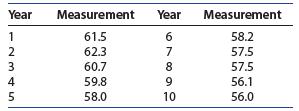
Construct a line chart to describe the data
Fantastic news! We've Found the answer you've been seeking!
Step by Step Answer:

Answered By
Stacy kosgei
I offer quality, original and timely services; Highly credible and void of plagiarism. Your success is my pleasure.
2+ Reviews
10+ Question Solved
Related Book For 

Introduction To Probability And Statistics
ISBN: 9780357114469
15th Edition
Authors: William Mendenhall Iii , Robert Beaver , Barbara Beaver
Question Posted:
