

Question
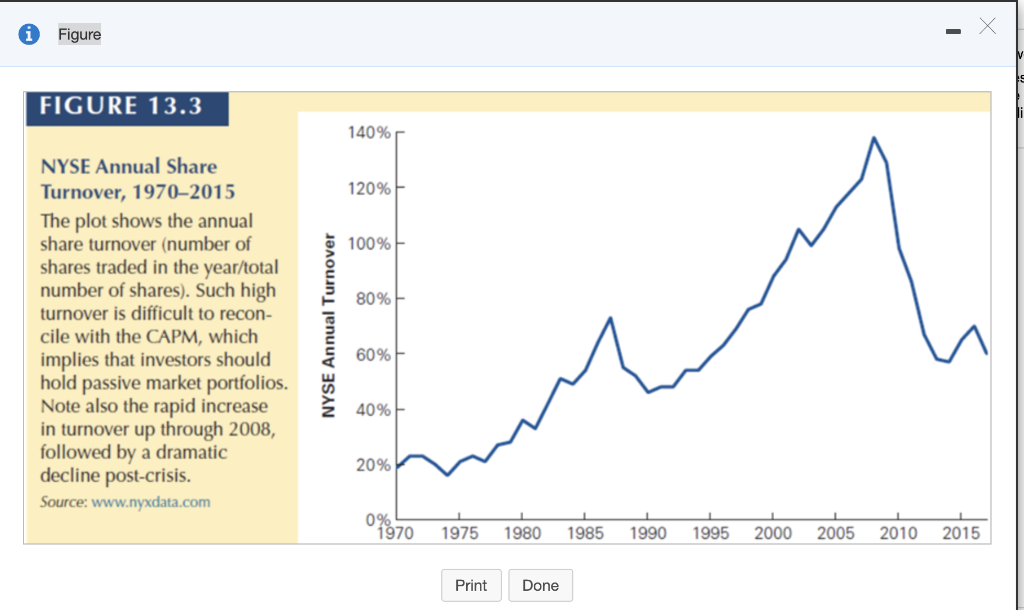
To put the turnover of Figure 13.3, , into perspective, let's do a back of the envelope calculation of what an investor's average turnover per
To put the turnover of Figure 13.3,
, into perspective, let's do a back of the envelope calculation of what an investor's average turnover per stock would be were he to follow a policy of investing in the S&P 500 portfolio. Because the portfolio is value weighted, the trading would be required when Standard and Poor's changes the constituent stocks. (Let's ignore additional, but less important reasons like new share issuances and repurchases.) Assuming they change 23 stocks a year (the historical average since 1962) what would you estimate the investor's per stock share turnover to be? Assume that the average total number of shares outstanding for the stocks that are added or deleted from the index is the same as the average number of shares outstanding for S&P 500 stocks.
The investor's per stock share turnover is .................%. (Round to one decimal place.)
Step by Step Solution
There are 3 Steps involved in it
Step: 1

Get Instant Access to Expert-Tailored Solutions
See step-by-step solutions with expert insights and AI powered tools for academic success
Step: 2

Step: 3
Ace Your Homework with AI
Get the answers you need in no time with our AI-driven, step-by-step assistance
Get Started
Financial Development Institutions Growth And Poverty Reduction
Authors: Basudeb Guha Khasnobis, George Mavrotas
2008 Edition
0230201776, 978-0230201774