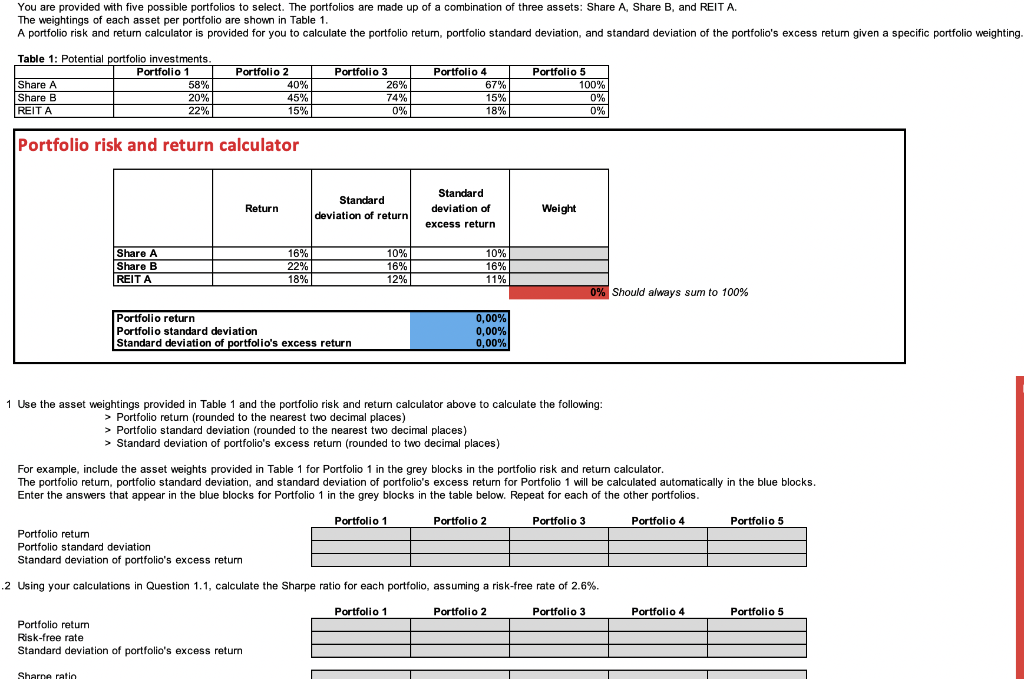
To select the optimal portfolio put the weights in the calculator sheet and note down the Portfolio return and portfolio standard deviation of all the five cases.
Then divide Return and Standard deviation. This would be the return per unit of risk. The Portfolio with the highest return per unit of risk would be the best portfolio.

You are provided with five possible portfolios to select. The portfolios are made up of a combination of three assets: Share A, Share B, and REIT A. The weightings of each asset per portfolio are shown in Table 1. A portfolio risk and return calculator is provided for you to calculate the portfolio return, portfolio standard deviation, and standard deviation of the portfolio's excess return given a specific portfolio weighting. Table 1: Potential portfolio investments. Portfolio 1 Share A 58% Share B 20% REITA 22% Portfolio 2 40% 45% 15% Portfolio 3 26% 74% 0% Portfolio 4 67% 15% 18% Portfolio 5 100% 0% 0% Portfolio risk and return calculator Return Standard deviation of return Standard deviation of excess return Weight Share A Share B REITA 16% 22% 18% 10% 16% 12% 10% 16% 11% 1 0% Should always sum to 100% Portfolio return Portfolio standard deviation Standard deviation of portfolio's excess return 0,00% 0,00% 0,00% 1 Use the asset weightings provided in Table 1 and the portfolio risk and return calculator above to calculate the following: > Portfolio return (rounded to the nearest two decimal places) > Portfolio standard deviation (rounded to the nearest two decimal places) > Standard deviation of portfolio's excess return (rounded to two decimal places) For example, include the asset weights provided in Table 1 for Portfolio 1 in the grey blocks in the portfolio risk and return calculator. The portfolio retum, portfolio standard deviation, and standard deviation of portfolio's excess return for Portfolio 1 will be calculated automatically in the blue blocks. Enter the answers that appear in the blue blocks for Portfolio 1 in the grey blocks in the table below. Repeat for each of the other portfolios. Portfolio 1 Portfolio 2 Portfolio 3 Portfolio 4 Portfolio 5 Portfolio return Portfolio standard deviation Standard deviation of portfolio's excess return .2 Using your calculations in Question 1.1, calculate the Sharpe ratio for each portfolio, assuming a risk-free rate of 2.6%. Portfolio 1 Portfolio 2 Portfolio 3 Portfolio 4 Portfolio 5 Portfolio return Risk-free rate Standard deviation of portfolio's excess return Sharna ratio You are provided with five possible portfolios to select. The portfolios are made up of a combination of three assets: Share A, Share B, and REIT A. The weightings of each asset per portfolio are shown in Table 1. A portfolio risk and return calculator is provided for you to calculate the portfolio return, portfolio standard deviation, and standard deviation of the portfolio's excess return given a specific portfolio weighting. Table 1: Potential portfolio investments. Portfolio 1 Share A 58% Share B 20% REITA 22% Portfolio 2 40% 45% 15% Portfolio 3 26% 74% 0% Portfolio 4 67% 15% 18% Portfolio 5 100% 0% 0% Portfolio risk and return calculator Return Standard deviation of return Standard deviation of excess return Weight Share A Share B REITA 16% 22% 18% 10% 16% 12% 10% 16% 11% 1 0% Should always sum to 100% Portfolio return Portfolio standard deviation Standard deviation of portfolio's excess return 0,00% 0,00% 0,00% 1 Use the asset weightings provided in Table 1 and the portfolio risk and return calculator above to calculate the following: > Portfolio return (rounded to the nearest two decimal places) > Portfolio standard deviation (rounded to the nearest two decimal places) > Standard deviation of portfolio's excess return (rounded to two decimal places) For example, include the asset weights provided in Table 1 for Portfolio 1 in the grey blocks in the portfolio risk and return calculator. The portfolio retum, portfolio standard deviation, and standard deviation of portfolio's excess return for Portfolio 1 will be calculated automatically in the blue blocks. Enter the answers that appear in the blue blocks for Portfolio 1 in the grey blocks in the table below. Repeat for each of the other portfolios. Portfolio 1 Portfolio 2 Portfolio 3 Portfolio 4 Portfolio 5 Portfolio return Portfolio standard deviation Standard deviation of portfolio's excess return .2 Using your calculations in Question 1.1, calculate the Sharpe ratio for each portfolio, assuming a risk-free rate of 2.6%. Portfolio 1 Portfolio 2 Portfolio 3 Portfolio 4 Portfolio 5 Portfolio return Risk-free rate Standard deviation of portfolio's excess return Sharna ratio


