

Answered step by step
Verified Expert Solution
Question
1 Approved Answer
to use the data just as you had it in Excel to get the acceleration directly from the time and position data. The polynomial equation
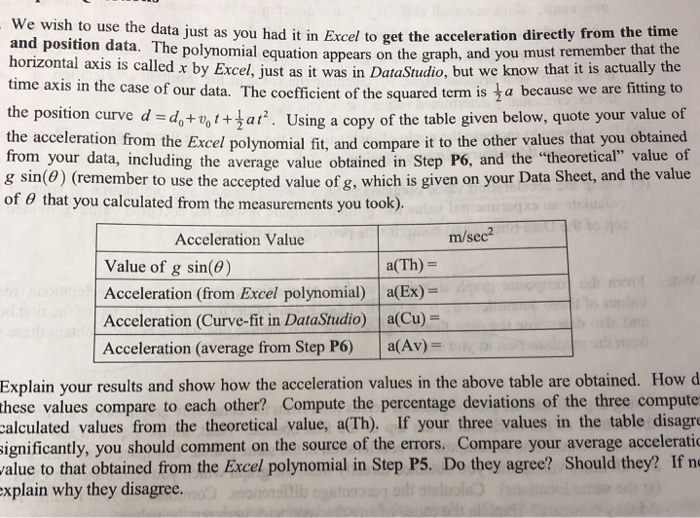
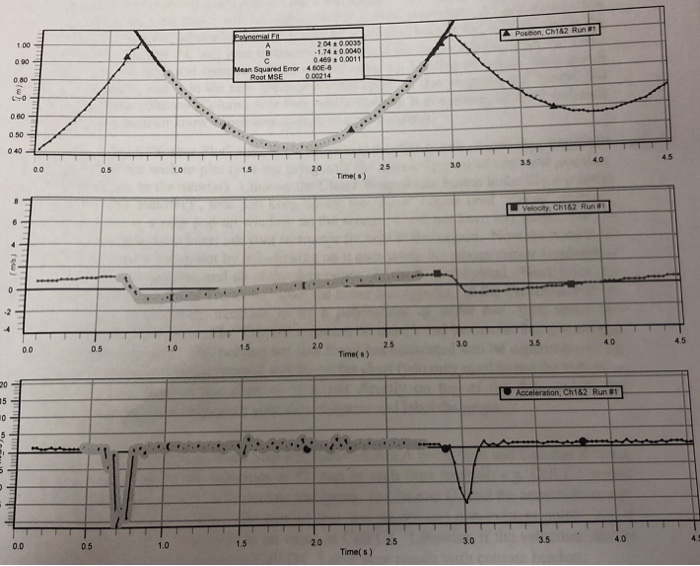
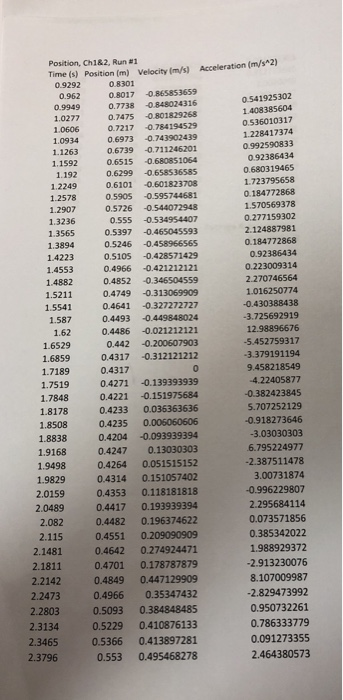
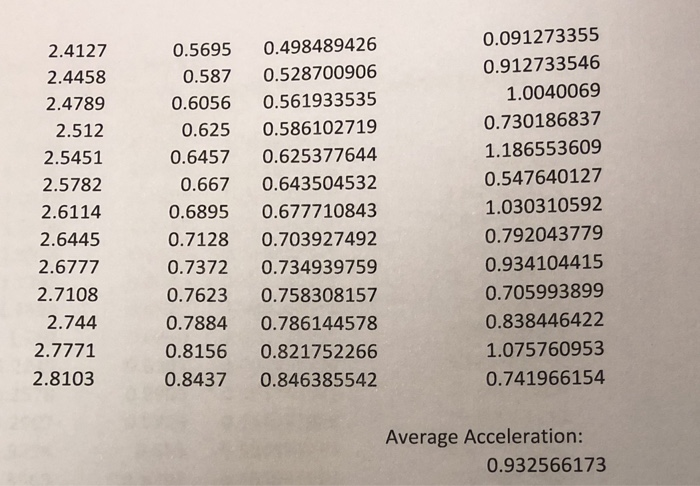
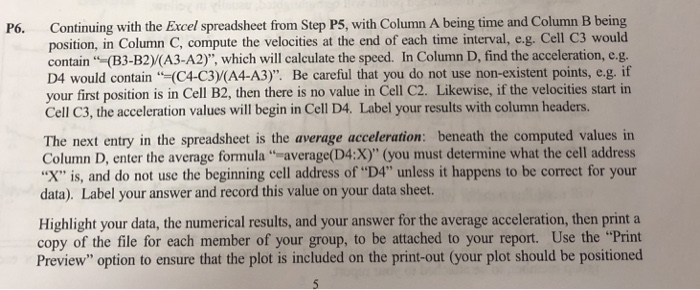
 to use the data just as you had it in Excel to get the acceleration directly from the time and position data. The polynomial equation appears on the graph, and y horizontal axis is called x by Excel, time axis in the case of our data. The Just as it was in DataStudio, but we know that it is actually the coefficient of the squared term is a because we are fitting to the position curve dd+,ttar. Using a copy of the table given below, quote your value of the acceleration from the Excel polynomial fit, and compare it to the other values that you obtained from your data, including the average value obtained in Step P6, and the theoretical value of g sin(O) (remember to use the accepted value of g, which is given on your Data Sheet, and the value of 0 that you calculated from the measurements you took) Acceleration Value m/sec2 Value of g sin(e) Acceleration (from Excel polynomial) a(Ex) Acceleration (Curve-fit in DataStudio a(Cu) Acceleration (average from Step P6) a(Av) a(Th)- Explain your results and show how the acceleration values in the above table are obtained. How d these values compare to cach other? Compute the percentage deviations of the three compute calculated values from the theoretical value, a(Th). If your three values in the table disagr ignificantly, you should comment on the source of the errors. Compare your average accelerati alue to that obtained from the Excel polynomial in Step P5. Do they agree? Should they? If n xplain why they disagree. to use the data just as you had it in Excel to get the acceleration directly from the time and position data. The polynomial equation appears on the graph, and y horizontal axis is called x by Excel, time axis in the case of our data. The Just as it was in DataStudio, but we know that it is actually the coefficient of the squared term is a because we are fitting to the position curve dd+,ttar. Using a copy of the table given below, quote your value of the acceleration from the Excel polynomial fit, and compare it to the other values that you obtained from your data, including the average value obtained in Step P6, and the theoretical value of g sin(O) (remember to use the accepted value of g, which is given on your Data Sheet, and the value of 0 that you calculated from the measurements you took) Acceleration Value m/sec2 Value of g sin(e) Acceleration (from Excel polynomial) a(Ex) Acceleration (Curve-fit in DataStudio a(Cu) Acceleration (average from Step P6) a(Av) a(Th)- Explain your results and show how the acceleration values in the above table are obtained. How d these values compare to cach other? Compute the percentage deviations of the three compute calculated values from the theoretical value, a(Th). If your three values in the table disagr ignificantly, you should comment on the source of the errors. Compare your average accelerati alue to that obtained from the Excel polynomial in Step P5. Do they agree? Should they? If n xplain why they disagree
Step by Step Solution
There are 3 Steps involved in it
Step: 1

Get Instant Access to Expert-Tailored Solutions
See step-by-step solutions with expert insights and AI powered tools for academic success
Step: 2

Step: 3
Ace Your Homework with AI
Get the answers you need in no time with our AI-driven, step-by-step assistance
Get Started
Transact SQL Cookbook Help For Database Programmers
Authors: Ales Spetic, Jonathan Gennick
1st Edition
1565927567, 978-1565927568