Answered step by step
Verified Expert Solution
Question
1 Approved Answer
To who commented on my question, can I email you the excel spreadsheet? or Each of the three assignments in this course will have two
To who commented on my question, can I email you the excel spreadsheet?
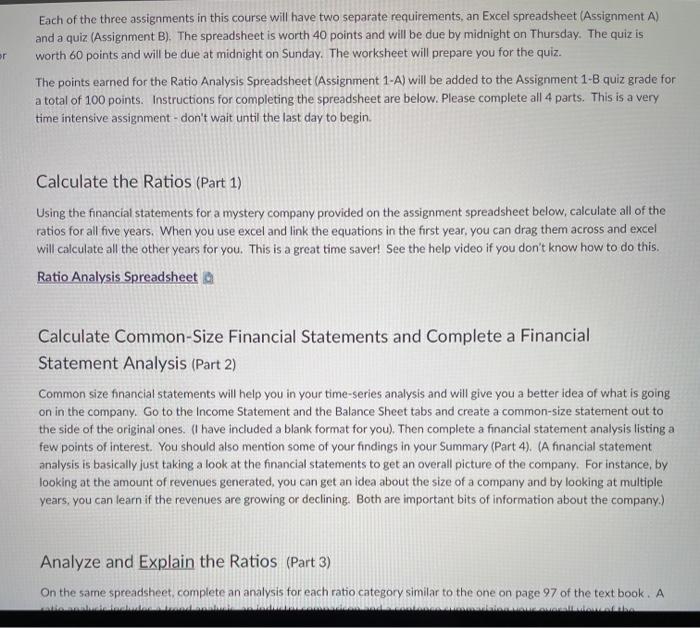
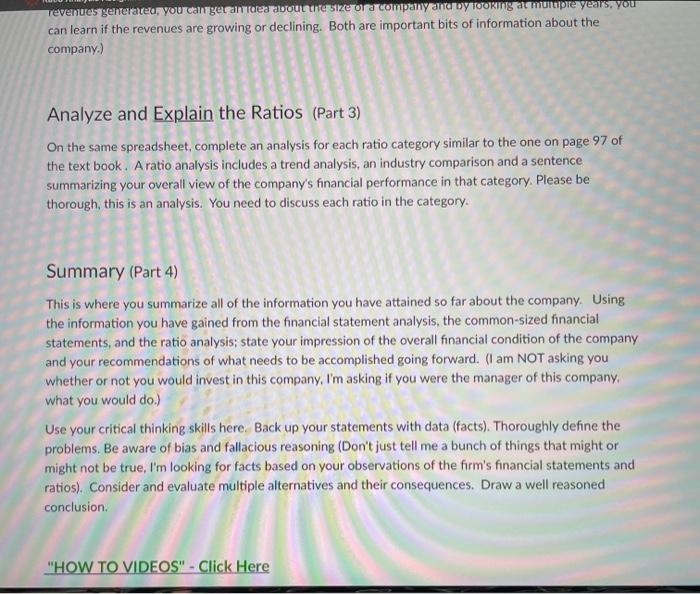
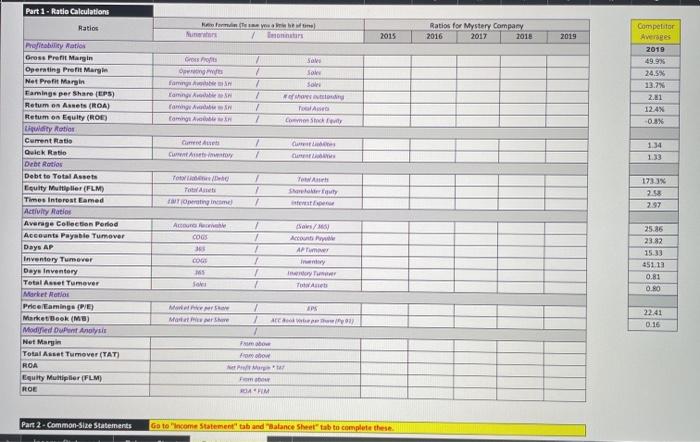
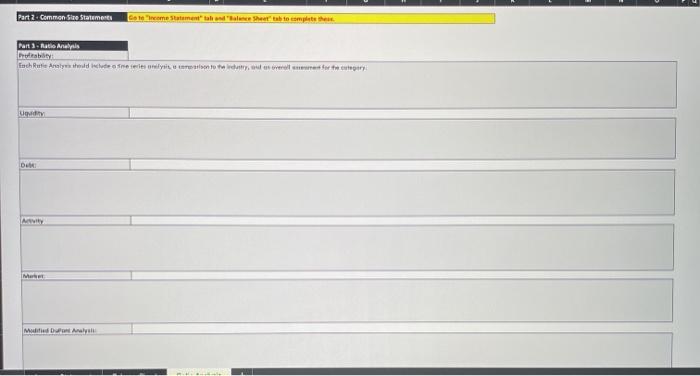
or Each of the three assignments in this course will have two separate requirements, an Excel spreadsheet (Assignment A) and a quiz (Assignment B). The spreadsheet is worth 40 points and will be due by midnight on Thursday. The quiz is worth 60 points and will be due at midnight on Sunday. The worksheet will prepare you for the quiz. The points earned for the Ratio Analysis Spreadsheet (Assignment 1-A) will be added to the Assignment 1-8 quiz grade for a total of 100 points. Instructions for completing the spreadsheet are below. Please complete all 4 parts. This is a very time intensive assignment - don't wait until the last day to begin. Calculate the Ratios (Part 1) Using the financial statements for a mystery company provided on the assignment spreadsheet below, calculate all of the ratios for all five years. When you use excel and link the equations in the first year, you can drag them across and excel will calculate all the other years for you. This is a great time saver! See the help video if you don't know how to do this. Ratio Analysis Spreadsheet Calculate Common-Size Financial Statements and Complete a Financial Statement Analysis (Part 2) Common size financial statements will help you in your time-series analysis and will give you a better idea of what is going on in the company. Go to the Income Statement and the Balance Sheet tabs and create a common-size statement out to the side of the original ones. (I have included a blank format for you). Then complete a financial statement analysis listing a few points of interest. You should also mention some of your findings in your Summary (Part 4). (A financial statement analysis is basically just taking a look at the financial statements to get an overall picture of the company. For instance, by looking at the amount of revenues generated, you can get an idea about the size of a company and by looking at multiple years, you can learn if the revenues are growing or declining. Both are important bits of information about the company.) Analyze and Explain the Ratios (Part 3) On the same spreadsheet, complete an analysis for each ratio category similar to the one on page 97 of the text book. A revenues generated, you can gecan Tearoon te size or company antudy Took a muncpre years, you can learn if the revenues are growing or declining. Both are important bits of information about the company.) Analyze and Explain the Ratios (Part 3) On the same spreadsheet, complete an analysis for each ratio category similar to the one on page 97 of the text book. A ratio analysis includes a trend analysis, an industry comparison and a sentence summarizing your overall view of the company's financial performance in that category. Please be thorough, this is an analysis. You need to discuss each ratio in the category. Summary (Part 4) This is where you summarize all of the information you have attained so far about the company. Using the information you have gained from the financial statement analysis, the common-sized financial statements, and the ratio analysis; state your impression of the overall financial condition of the company and your recommendations of what needs to be accomplished going forward. (I am NOT asking you whether or not you would invest in this company, I'm asking if you were the manager of this company, what you would do.) Use your critical thinking skills here. Back up your statements with data (facts). Thoroughly define the problems. Be aware of bias and fallacious reasoning (Don't just tell me a bunch of things that might or might not be true, I'm looking for facts based on your observations of the firm's financial statements and ratios). Consider and evaluate multiple alternatives and their consequences. Draw a well reasoned conclusion "HOW TO VIDEOS" - Click Here Ratios for Mystery Company 2016 2017 2018 moins 2015 2019 So sare Groot Og famine Lamin famigo Coming 7 7 4 / 2 Competitor Averages 2019 49.9% 24.5% 13.2% 2.1 12.4% 0.8% Tool Commenti Current CA Cs 1 1 1.34 1.33 TO Part 1 - Ratle Calculations Ratios Profitability Ratio Gross Prof Marin Operating Profit Margin Net Prefit Margin Caminge per Share (EPS) Retum en Annet (ROA) Retum on Equity (ROE) city Rotor Current Ratio Quick Ratio Debt Ratios Debt to Total Assets Louity Multiplier (FLM) Times Interest Eamed Activity Ratio Average Collection Period Accounts Payable Tumover Days AP Inventory Tumever Daye Inventory Total Asset Tumover Market Holos Price Caminge (PE) MarketBook (MB) Modified Analysis Net Margin Total Asset Tumover (TAT) ROA Equity Multiplier (FLM) ROE 1 2 1 Share 1733X 2.58 2.97 Operating meme AL COGS 3 COGE ES/ Account AP Tume 25.86 23.82 15.13 451.13 0.81 1 1 1 SO 0.80 Mwa IPS 22.41 MEN 7 1 0.16 Promobow Fm AM Part 2 - Common-siae Statements Go to "income Statement tab and Balance Sheet" tab to complete these Part 2 Common Siro Statements estreme Statement the heart to complete Part. Ratio Analis Potability Each Rute Analyse des ne seroty, for the DUR Mers MA 3 Lui Debt 3 Martat 1 MA - Sum All Up or Each of the three assignments in this course will have two separate requirements, an Excel spreadsheet (Assignment A) and a quiz (Assignment B). The spreadsheet is worth 40 points and will be due by midnight on Thursday. The quiz is worth 60 points and will be due at midnight on Sunday. The worksheet will prepare you for the quiz. The points earned for the Ratio Analysis Spreadsheet (Assignment 1-A) will be added to the Assignment 1-8 quiz grade for a total of 100 points. Instructions for completing the spreadsheet are below. Please complete all 4 parts. This is a very time intensive assignment - don't wait until the last day to begin. Calculate the Ratios (Part 1) Using the financial statements for a mystery company provided on the assignment spreadsheet below, calculate all of the ratios for all five years. When you use excel and link the equations in the first year, you can drag them across and excel will calculate all the other years for you. This is a great time saver! See the help video if you don't know how to do this. Ratio Analysis Spreadsheet Calculate Common-Size Financial Statements and Complete a Financial Statement Analysis (Part 2) Common size financial statements will help you in your time-series analysis and will give you a better idea of what is going on in the company. Go to the Income Statement and the Balance Sheet tabs and create a common-size statement out to the side of the original ones. (I have included a blank format for you). Then complete a financial statement analysis listing a few points of interest. You should also mention some of your findings in your Summary (Part 4). (A financial statement analysis is basically just taking a look at the financial statements to get an overall picture of the company. For instance, by looking at the amount of revenues generated, you can get an idea about the size of a company and by looking at multiple years, you can learn if the revenues are growing or declining. Both are important bits of information about the company.) Analyze and Explain the Ratios (Part 3) On the same spreadsheet, complete an analysis for each ratio category similar to the one on page 97 of the text book. A revenues generated, you can gecan Tearoon te size or company antudy Took a muncpre years, you can learn if the revenues are growing or declining. Both are important bits of information about the company.) Analyze and Explain the Ratios (Part 3) On the same spreadsheet, complete an analysis for each ratio category similar to the one on page 97 of the text book. A ratio analysis includes a trend analysis, an industry comparison and a sentence summarizing your overall view of the company's financial performance in that category. Please be thorough, this is an analysis. You need to discuss each ratio in the category. Summary (Part 4) This is where you summarize all of the information you have attained so far about the company. Using the information you have gained from the financial statement analysis, the common-sized financial statements, and the ratio analysis; state your impression of the overall financial condition of the company and your recommendations of what needs to be accomplished going forward. (I am NOT asking you whether or not you would invest in this company, I'm asking if you were the manager of this company, what you would do.) Use your critical thinking skills here. Back up your statements with data (facts). Thoroughly define the problems. Be aware of bias and fallacious reasoning (Don't just tell me a bunch of things that might or might not be true, I'm looking for facts based on your observations of the firm's financial statements and ratios). Consider and evaluate multiple alternatives and their consequences. Draw a well reasoned conclusion "HOW TO VIDEOS" - Click Here Ratios for Mystery Company 2016 2017 2018 moins 2015 2019 So sare Groot Og famine Lamin famigo Coming 7 7 4 / 2 Competitor Averages 2019 49.9% 24.5% 13.2% 2.1 12.4% 0.8% Tool Commenti Current CA Cs 1 1 1.34 1.33 TO Part 1 - Ratle Calculations Ratios Profitability Ratio Gross Prof Marin Operating Profit Margin Net Prefit Margin Caminge per Share (EPS) Retum en Annet (ROA) Retum on Equity (ROE) city Rotor Current Ratio Quick Ratio Debt Ratios Debt to Total Assets Louity Multiplier (FLM) Times Interest Eamed Activity Ratio Average Collection Period Accounts Payable Tumover Days AP Inventory Tumever Daye Inventory Total Asset Tumover Market Holos Price Caminge (PE) MarketBook (MB) Modified Analysis Net Margin Total Asset Tumover (TAT) ROA Equity Multiplier (FLM) ROE 1 2 1 Share 1733X 2.58 2.97 Operating meme AL COGS 3 COGE ES/ Account AP Tume 25.86 23.82 15.13 451.13 0.81 1 1 1 SO 0.80 Mwa IPS 22.41 MEN 7 1 0.16 Promobow Fm AM Part 2 - Common-siae Statements Go to "income Statement tab and Balance Sheet" tab to complete these Part 2 Common Siro Statements estreme Statement the heart to complete Part. Ratio Analis Potability Each Rute Analyse des ne seroty, for the DUR Mers MA 3 Lui Debt 3 Martat 1 MA - Sum All UpStep by Step Solution
There are 3 Steps involved in it
Step: 1

Get Instant Access to Expert-Tailored Solutions
See step-by-step solutions with expert insights and AI powered tools for academic success
Step: 2

Step: 3

Ace Your Homework with AI
Get the answers you need in no time with our AI-driven, step-by-step assistance
Get Started


