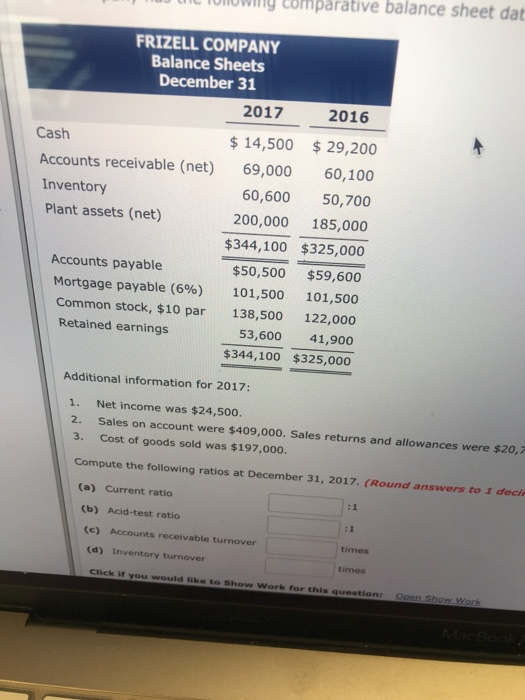
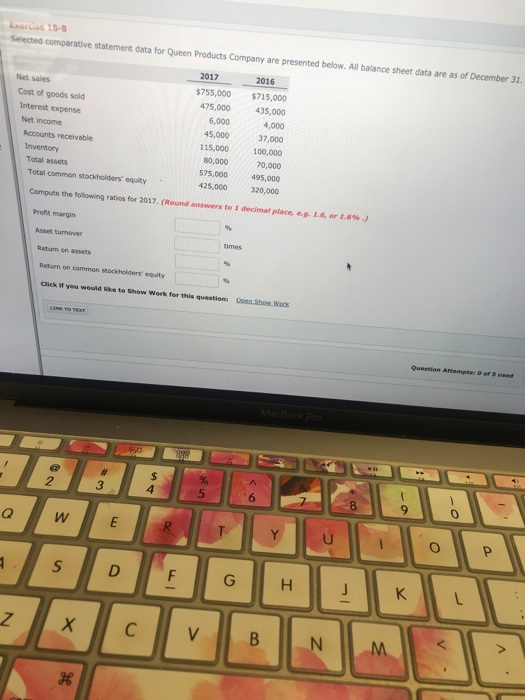
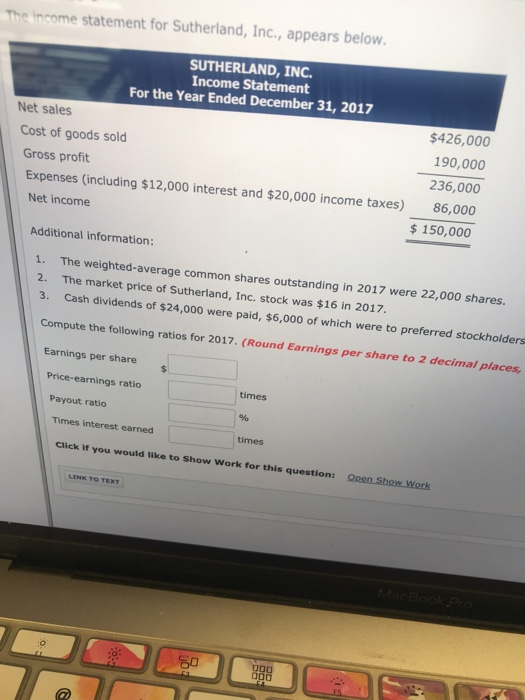
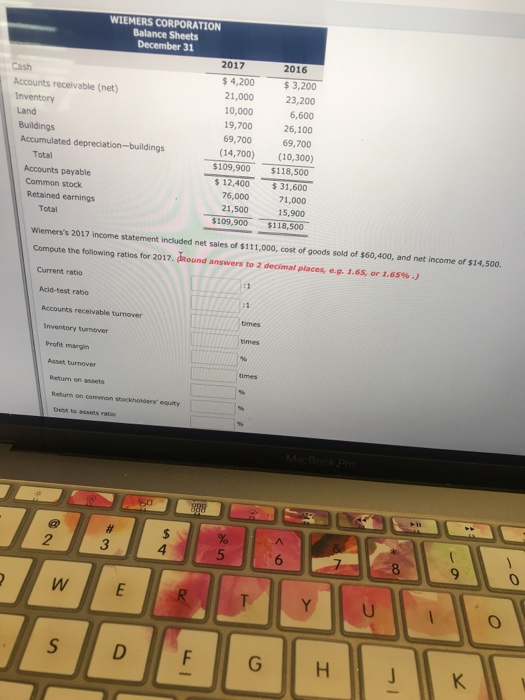
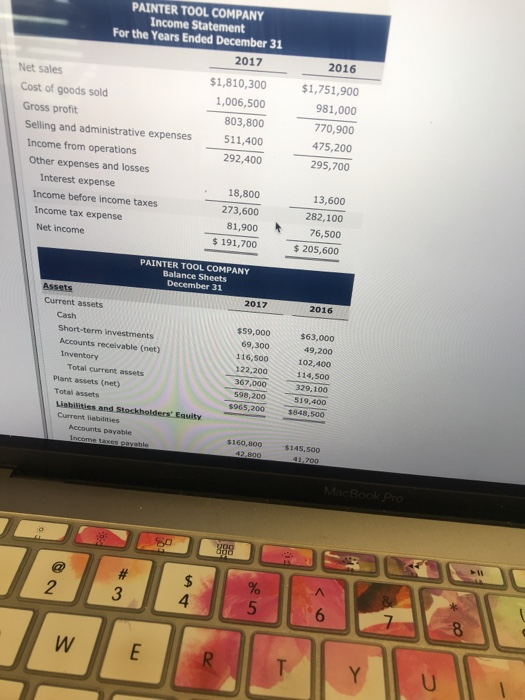
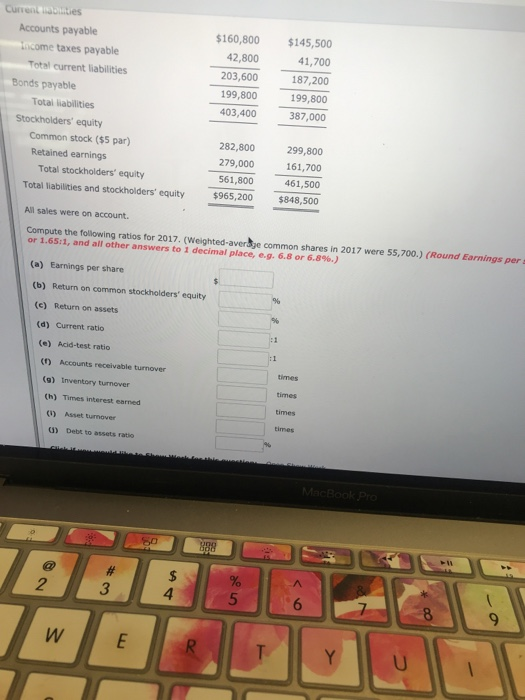
Tomowing comparative balance sheet dat FRIZELL COMPANY Balance Sheets December 31 2017 2016 $14,500 29,200 Accounts receivable (net 69,000 60,100 60,600 50,700 Cash Inventory Plant assets (net) 200,000 185,000 $344,100 $325,000 $50,500 $59,600 Mortgage payable (696) 101,500 101,500 Common stock, $10 par 138,500 122,000 53,600 41,900 $344,100 $325,000 Accounts payable Retained earnings Additional information for 2017: 1. Net income was $24,500. 2. Sales on account were $409,000. Sales returns and allowances were $20,7 3. Cost of goods sold was $197,000 Compute the following ratios at December 31, 2017. (Round answers to 1 deci (a) Current ratio (b) Acid-test ratio (c) Accounts receivable turnover (d) Inventory turnover times Click if you would like to Show Work for this question Selected comparative statement data for Queen Products Company are presented below. All balance sheet data are as of December 31 2017 2016 $755,000 $715,000 475,000 435,000 4,000 37,000 15,000 100,000 70,000 575,000495,000 425,000 320,000 Net sales Cost of goods sold Interest expense Net income 45,000 Accounts receivable Inventory Total assets Total common stockholders' equity 80,000 Com pute the fellowing ratos for 2017. (Round answers to 1 decinal place, e.g. 1.6, or 1.6% .) Profit margin Retun on assets Return on common stockholders' equity Click if you would like to Show Work for this questions Oen Show Weck Question Atampts: o or S wsed 3 9 K. The income statement for Sutherland, Inc., appears below SUTHERLAND, INC Income Statement For the Year Ended December 31, 2017 $426,000 190,000 236,000 86,000 Net sales Cost of goods sold Gross profit Expenses (including $12,000 interest and $20,000 income taxes) Net income 150,000 Additional information: 1. The weighted-average common shares outstanding in 2017 were 22,000 shares. 2 The market price of Sutherland, Inc. stock was $16 in 2017. 3. Cash dividends of $24,000 were paid, $6,000 of which were to preferred stockholders Compute the following ratios for 2017. (Round Earnings per share to 2 decimal places Earnings per share Price-earnings ratio times Payout ratio Times interest earned times Click If you would like to Show Work for this question LINK TO 60 WIEMERS CORPORATION Balance Sheets 2017 2016 3,200 21,000 23,200 6,600 19,700 26,100 69,700 (14,700 (10,300) $109,900 $118,500 $ 12,400 $31,600 76,000 71,000 15,900 $109,900 $118,500 4,200 Accounts receivable (net) 10,000 69,700 Accumulated depreciation-buildings Total Accounts payable Common stock Retained earnings 21,500 Total Wiemers's 2017 income statement included net sales of $111,000, cost of goods sold of $60,400, and net income of $14,500 Compute the following ratios for 2017. dRound answers to 2 decimal places, e.g. 1.65, or 1.659%.) Current ratio Acid-test ratio Accounts receivable turnover inventory tumover Profit margin Return on assets 3 4 5 PAINTER TOOL COMPANY Income Statement For the Years Ended December 31 2016 1,751,900 981,000 770,900 475,200 295,700 2017 Net sales Cost of goods sold Gross profit Selling and administrative expenses $1,810,300 1,006,500 803,800 511,400 292,400 Income from operations Other expenses and losses Interest expense 18,800 273,600 81,900 $ 191,700 13,600 282,100 76,500 s 205,600 Income before income taxes Income tax expense Net income PAINTER TOOL COMPANY Balance Sheets December 31 2017 2016 Current assets Cash Short-term investments Accounts receivable (net) $59,000 69,300 116,500 122,200 367,000 $63,000 49,200 102,400 114,500 329,100 598,200519,400 $965,200$848,500 Total current assets Plant assets (net) Total assets Current liabilities payable $160,800 145,500 2 3 4 TY U 160,800 $145,500 41,700 187,200 199,800 387,000 Accounts payable 42,800 203,600 199,800 403,400 ncome taxes payable Total current liabilities Bonds payable Totai liabilities Stockholders' equity Common stock ($5 par) Retained earnings 282,800 299,800 279,000 161,700 561,800 461,500 965,200 $848,500 Total stockholders' equity Total liabilities and stockholders' equity All sales were on account. Compute the following ratios for 2017. (Weighted-averdye common shares in 2017 were 55,700.) (Round or 1.6511, and all other answers to 1 decimal place, e.g. 6.8 or 6.8%.) Earnings pers (a) Earnings per share (b) Return on common stockholders' equity (e) Return on assets (d) Current ratio (e) Acid-test ratio (0 Accounts receivable turnover times (9) Inventory turnover (h) Times interest earned () Asset turnover times ) Debt to assets ratio 2 3 4 5 9 Tomowing comparative balance sheet dat FRIZELL COMPANY Balance Sheets December 31 2017 2016 $14,500 29,200 Accounts receivable (net 69,000 60,100 60,600 50,700 Cash Inventory Plant assets (net) 200,000 185,000 $344,100 $325,000 $50,500 $59,600 Mortgage payable (696) 101,500 101,500 Common stock, $10 par 138,500 122,000 53,600 41,900 $344,100 $325,000 Accounts payable Retained earnings Additional information for 2017: 1. Net income was $24,500. 2. Sales on account were $409,000. Sales returns and allowances were $20,7 3. Cost of goods sold was $197,000 Compute the following ratios at December 31, 2017. (Round answers to 1 deci (a) Current ratio (b) Acid-test ratio (c) Accounts receivable turnover (d) Inventory turnover times Click if you would like to Show Work for this question Selected comparative statement data for Queen Products Company are presented below. All balance sheet data are as of December 31 2017 2016 $755,000 $715,000 475,000 435,000 4,000 37,000 15,000 100,000 70,000 575,000495,000 425,000 320,000 Net sales Cost of goods sold Interest expense Net income 45,000 Accounts receivable Inventory Total assets Total common stockholders' equity 80,000 Com pute the fellowing ratos for 2017. (Round answers to 1 decinal place, e.g. 1.6, or 1.6% .) Profit margin Retun on assets Return on common stockholders' equity Click if you would like to Show Work for this questions Oen Show Weck Question Atampts: o or S wsed 3 9 K. The income statement for Sutherland, Inc., appears below SUTHERLAND, INC Income Statement For the Year Ended December 31, 2017 $426,000 190,000 236,000 86,000 Net sales Cost of goods sold Gross profit Expenses (including $12,000 interest and $20,000 income taxes) Net income 150,000 Additional information: 1. The weighted-average common shares outstanding in 2017 were 22,000 shares. 2 The market price of Sutherland, Inc. stock was $16 in 2017. 3. Cash dividends of $24,000 were paid, $6,000 of which were to preferred stockholders Compute the following ratios for 2017. (Round Earnings per share to 2 decimal places Earnings per share Price-earnings ratio times Payout ratio Times interest earned times Click If you would like to Show Work for this question LINK TO 60 WIEMERS CORPORATION Balance Sheets 2017 2016 3,200 21,000 23,200 6,600 19,700 26,100 69,700 (14,700 (10,300) $109,900 $118,500 $ 12,400 $31,600 76,000 71,000 15,900 $109,900 $118,500 4,200 Accounts receivable (net) 10,000 69,700 Accumulated depreciation-buildings Total Accounts payable Common stock Retained earnings 21,500 Total Wiemers's 2017 income statement included net sales of $111,000, cost of goods sold of $60,400, and net income of $14,500 Compute the following ratios for 2017. dRound answers to 2 decimal places, e.g. 1.65, or 1.659%.) Current ratio Acid-test ratio Accounts receivable turnover inventory tumover Profit margin Return on assets 3 4 5 PAINTER TOOL COMPANY Income Statement For the Years Ended December 31 2016 1,751,900 981,000 770,900 475,200 295,700 2017 Net sales Cost of goods sold Gross profit Selling and administrative expenses $1,810,300 1,006,500 803,800 511,400 292,400 Income from operations Other expenses and losses Interest expense 18,800 273,600 81,900 $ 191,700 13,600 282,100 76,500 s 205,600 Income before income taxes Income tax expense Net income PAINTER TOOL COMPANY Balance Sheets December 31 2017 2016 Current assets Cash Short-term investments Accounts receivable (net) $59,000 69,300 116,500 122,200 367,000 $63,000 49,200 102,400 114,500 329,100 598,200519,400 $965,200$848,500 Total current assets Plant assets (net) Total assets Current liabilities payable $160,800 145,500 2 3 4 TY U 160,800 $145,500 41,700 187,200 199,800 387,000 Accounts payable 42,800 203,600 199,800 403,400 ncome taxes payable Total current liabilities Bonds payable Totai liabilities Stockholders' equity Common stock ($5 par) Retained earnings 282,800 299,800 279,000 161,700 561,800 461,500 965,200 $848,500 Total stockholders' equity Total liabilities and stockholders' equity All sales were on account. Compute the following ratios for 2017. (Weighted-averdye common shares in 2017 were 55,700.) (Round or 1.6511, and all other answers to 1 decimal place, e.g. 6.8 or 6.8%.) Earnings pers (a) Earnings per share (b) Return on common stockholders' equity (e) Return on assets (d) Current ratio (e) Acid-test ratio (0 Accounts receivable turnover times (9) Inventory turnover (h) Times interest earned () Asset turnover times ) Debt to assets ratio 2 3 4 5 9
