
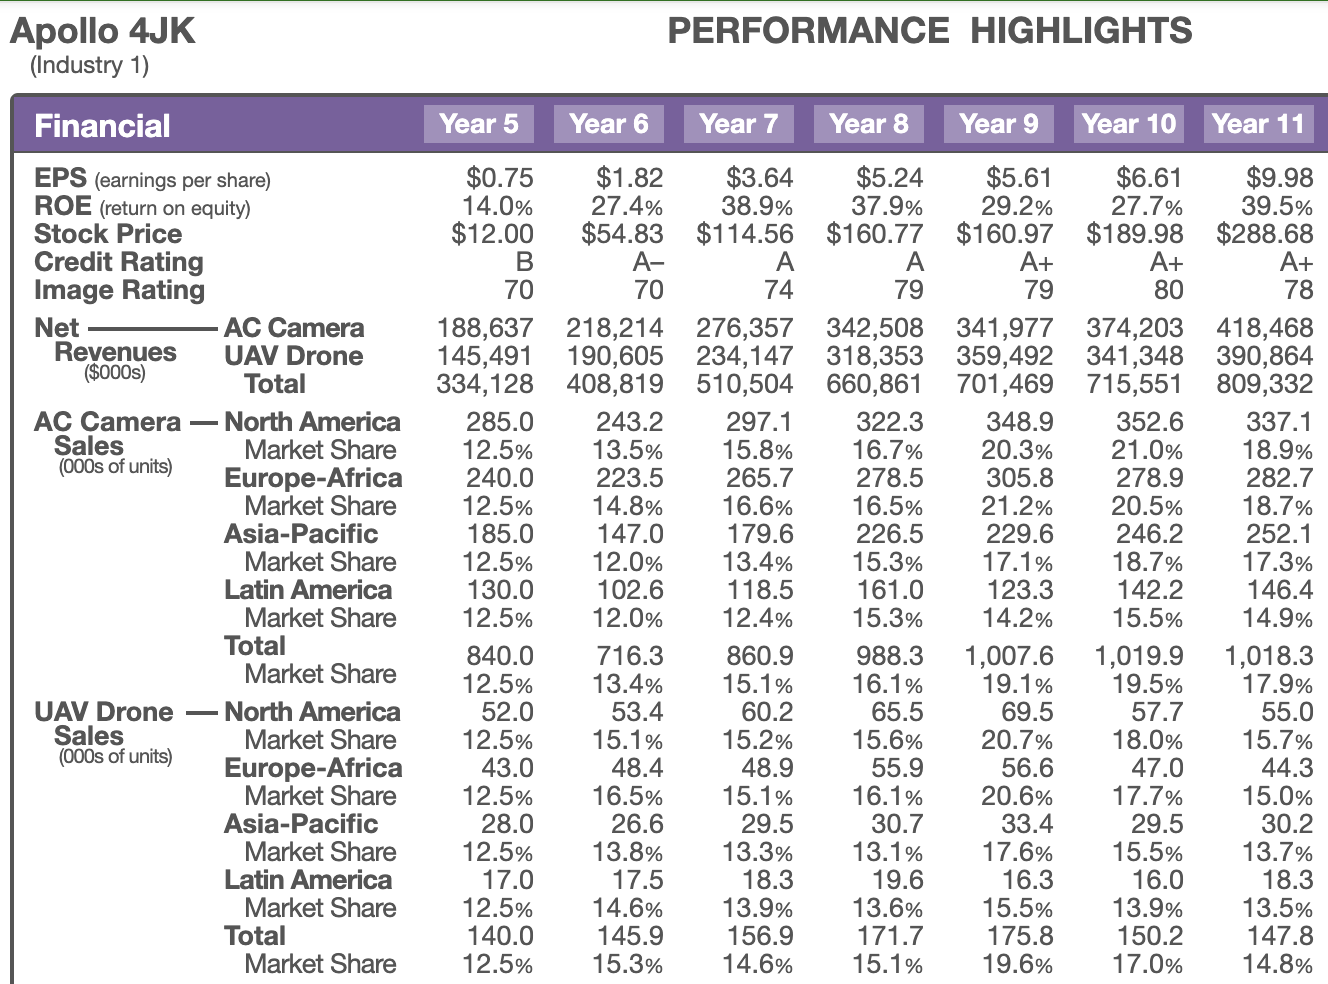
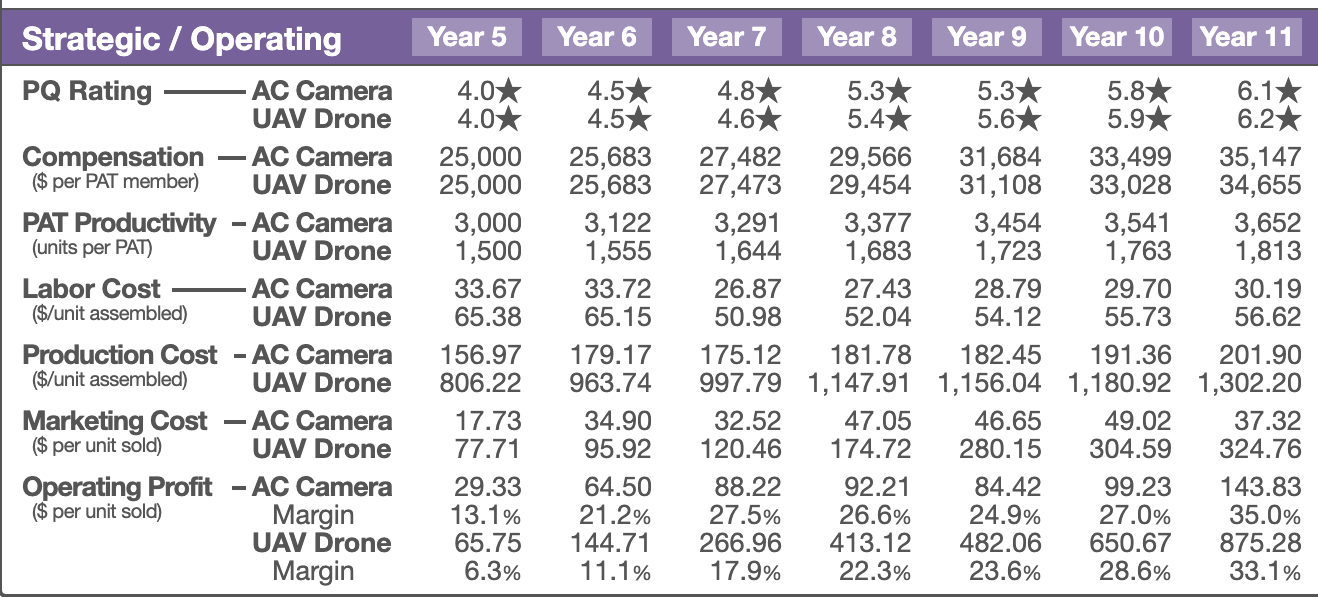
Tonight's Class: O Team Reports for Scored Round (Year 11) o How was the experience? What did you learn? Did you realize your expected results? o What surprised you? o What are your challenges? What's your strategy for the Scored Round/Year 12? Organizational Capabilities Structure, Design, and Organization Decsion-Making Executing the Strategy Teams Break for Meetings as needed PERFORMANCE HIGHLIGHTS Apollo 4JK (Industry 1) Financial Year 5 Year 6 Year 7 Year 8 Year 9 Year 10 Year 11 EPS (earnings per share) ROE (return on equity) Stock Price Credit Rating Image Rating Net AC Camera Revenues UAV Drone ($000s) Total AC Camera North America Sales Market Share (000s of units) Europe-Africa Market Share Asia-Pacific Market Share Latin America Market Share Total Market Share UAV Drone North America Sales Market Share (000s of units) Europe-Africa Market Share Asia-Pacific Market Share Latin America Market Share Total Market Share $0.75 $1.82 $3.64 $5.24 $5.61 14.0% 27.4% 38.9% 37.9% 29.2% $12.00 $54.83 $114.56 $160.77 $160.97 B A- A A A+ 70 70 74 79 79 188,637 218,214 276,357 342,508 341,977 145,491 190,605 234,147 318,353 359,492 334,128 408,819 510,504 660,861 701,469 285.0 243.2 297.1 322.3 348.9 12.5% 13.5% 15.8% 16.7% 20.3% 240.0 223.5 265.7 278.5 305.8 12.5% 14.8% 16.6% 16.5% 21.2% 185.0 147.0 179.6 226.5 229.6 12.5% 12.0% 13.4% 15.3% 17.1% 130.0 102.6 118.5 161.0 123.3 12.5% 12.0% 12.4% 15.3% 14.2% 840.0 716.3 860.9 988.3 1,007.6 12.5% 13.4% 15.1% 16.1% 19.1% 52.0 53.4 60.2 65.5 69.5 12.5% 15.1% 15.2% 15.6% 20.7% 43.0 48.4 48.9 55.9 56.6 12.5% 16.5% 15.1% 16.1% 20.6% 28.0 26.6 29.5 30.7 33.4 12.5% 13.8% 13.3% 13.1% 17.6% 17.0 17.5 18.3 19.6 16.3 12.5% 14.6% 13.9% 13.6% 15.5% 140.0 145.9 156.9 171.7 175.8 12.5% 15.3% 14.6% 15.1% 19.6% $6.61 $9.98 27.7% 39.5% $189.98 $288.68 A+ A+ 80 78 374,203 418,468 341,348 390,864 715,551 809,332 352.6 337.1 21.0% 18.9% 278.9 282.7 20.5% 18.7% 246.2 252.1 18.7% 17.3% 142.2 146.4 15.5% 14.9% 1,019.9 1,018.3 19.5% 17.9% 57.7 55.0 18.0% 15.7% 47.0 44.3 17.7% 15.0% 29.5 30.2 15.5% 13.7% 16.0 18.3 13.9% 13.5% 150.2 147.8 17.0% 14.8% Year 5 Year 6 Year 7 Year 8 Year 9 Year 10 Year 11 Strategic / Operating PQ Rating AC Camera UAV Drone Compensation AC Camera ($ per PAT member) UAV Drone PAT Productivity - AC Camera (units per PAT) UAV Drone Labor Cost AC Camera ($/unit assembled) UAV Drone Production Cost - AC Camera ($/unit assembled) UAV Drone Marketing Cost AC Camera ($ per unit sold) UAV Drone Operating Profit - AC Camera ($ per unit sold) Margin UAV Drone Margin 4.0% 4.0* 25,000 25,000 3,000 1,500 33.67 65.38 156.97 806.22 4.5* 4.5* 25,683 25,683 3,122 1,555 33.72 65.15 179.17 963.74 34.90 95.92 64.50 21.2% 144.71 11.1% 4.8% 5.3* 5.3* 5.8% 4.6% 5.4* 5.6* 5.9* 27,482 29,566 31,684 33,499 27,473 29,454 31,108 33,028 3,291 3,377 3,454 3,541 1,644 1,683 1,723 1,763 26.87 27.43 28.79 29.70 50.98 52.04 54.12 55.73 175.12 181.78 182.45 191.36 997.79 1,147.91 1,156.04 1,180.92 32.52 47.05 46.65 49.02 120.46 174.72 280.15 304.59 88.22 92.21 84.42 99.23 27.5% 26.6% 24.9% 27.0% 266.96 413.12 482.06 650.67 17.9% 22.3% 23.6% 28.6% 6.1* 6.2* 35,147 34,655 3,652 1,813 30.19 56.62 201.90 1,302.20 37.32 324.76 143.83 35.0% 875.28 33.1% 17.73 77.71 29.33 13.1% 65.75 6.3% Tonight's Class: O Team Reports for Scored Round (Year 11) o How was the experience? What did you learn? Did you realize your expected results? o What surprised you? o What are your challenges? What's your strategy for the Scored Round/Year 12? Organizational Capabilities Structure, Design, and Organization Decsion-Making Executing the Strategy Teams Break for Meetings as needed PERFORMANCE HIGHLIGHTS Apollo 4JK (Industry 1) Financial Year 5 Year 6 Year 7 Year 8 Year 9 Year 10 Year 11 EPS (earnings per share) ROE (return on equity) Stock Price Credit Rating Image Rating Net AC Camera Revenues UAV Drone ($000s) Total AC Camera North America Sales Market Share (000s of units) Europe-Africa Market Share Asia-Pacific Market Share Latin America Market Share Total Market Share UAV Drone North America Sales Market Share (000s of units) Europe-Africa Market Share Asia-Pacific Market Share Latin America Market Share Total Market Share $0.75 $1.82 $3.64 $5.24 $5.61 14.0% 27.4% 38.9% 37.9% 29.2% $12.00 $54.83 $114.56 $160.77 $160.97 B A- A A A+ 70 70 74 79 79 188,637 218,214 276,357 342,508 341,977 145,491 190,605 234,147 318,353 359,492 334,128 408,819 510,504 660,861 701,469 285.0 243.2 297.1 322.3 348.9 12.5% 13.5% 15.8% 16.7% 20.3% 240.0 223.5 265.7 278.5 305.8 12.5% 14.8% 16.6% 16.5% 21.2% 185.0 147.0 179.6 226.5 229.6 12.5% 12.0% 13.4% 15.3% 17.1% 130.0 102.6 118.5 161.0 123.3 12.5% 12.0% 12.4% 15.3% 14.2% 840.0 716.3 860.9 988.3 1,007.6 12.5% 13.4% 15.1% 16.1% 19.1% 52.0 53.4 60.2 65.5 69.5 12.5% 15.1% 15.2% 15.6% 20.7% 43.0 48.4 48.9 55.9 56.6 12.5% 16.5% 15.1% 16.1% 20.6% 28.0 26.6 29.5 30.7 33.4 12.5% 13.8% 13.3% 13.1% 17.6% 17.0 17.5 18.3 19.6 16.3 12.5% 14.6% 13.9% 13.6% 15.5% 140.0 145.9 156.9 171.7 175.8 12.5% 15.3% 14.6% 15.1% 19.6% $6.61 $9.98 27.7% 39.5% $189.98 $288.68 A+ A+ 80 78 374,203 418,468 341,348 390,864 715,551 809,332 352.6 337.1 21.0% 18.9% 278.9 282.7 20.5% 18.7% 246.2 252.1 18.7% 17.3% 142.2 146.4 15.5% 14.9% 1,019.9 1,018.3 19.5% 17.9% 57.7 55.0 18.0% 15.7% 47.0 44.3 17.7% 15.0% 29.5 30.2 15.5% 13.7% 16.0 18.3 13.9% 13.5% 150.2 147.8 17.0% 14.8% Year 5 Year 6 Year 7 Year 8 Year 9 Year 10 Year 11 Strategic / Operating PQ Rating AC Camera UAV Drone Compensation AC Camera ($ per PAT member) UAV Drone PAT Productivity - AC Camera (units per PAT) UAV Drone Labor Cost AC Camera ($/unit assembled) UAV Drone Production Cost - AC Camera ($/unit assembled) UAV Drone Marketing Cost AC Camera ($ per unit sold) UAV Drone Operating Profit - AC Camera ($ per unit sold) Margin UAV Drone Margin 4.0% 4.0* 25,000 25,000 3,000 1,500 33.67 65.38 156.97 806.22 4.5* 4.5* 25,683 25,683 3,122 1,555 33.72 65.15 179.17 963.74 34.90 95.92 64.50 21.2% 144.71 11.1% 4.8% 5.3* 5.3* 5.8% 4.6% 5.4* 5.6* 5.9* 27,482 29,566 31,684 33,499 27,473 29,454 31,108 33,028 3,291 3,377 3,454 3,541 1,644 1,683 1,723 1,763 26.87 27.43 28.79 29.70 50.98 52.04 54.12 55.73 175.12 181.78 182.45 191.36 997.79 1,147.91 1,156.04 1,180.92 32.52 47.05 46.65 49.02 120.46 174.72 280.15 304.59 88.22 92.21 84.42 99.23 27.5% 26.6% 24.9% 27.0% 266.96 413.12 482.06 650.67 17.9% 22.3% 23.6% 28.6% 6.1* 6.2* 35,147 34,655 3,652 1,813 30.19 56.62 201.90 1,302.20 37.32 324.76 143.83 35.0% 875.28 33.1% 17.73 77.71 29.33 13.1% 65.75 6.3%