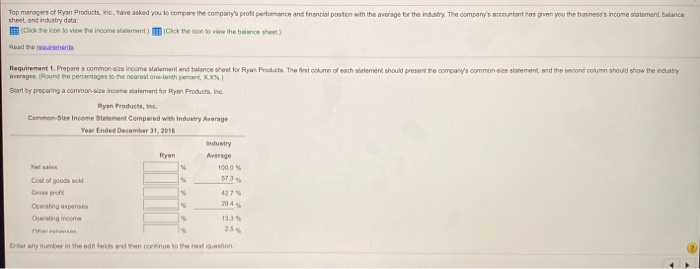
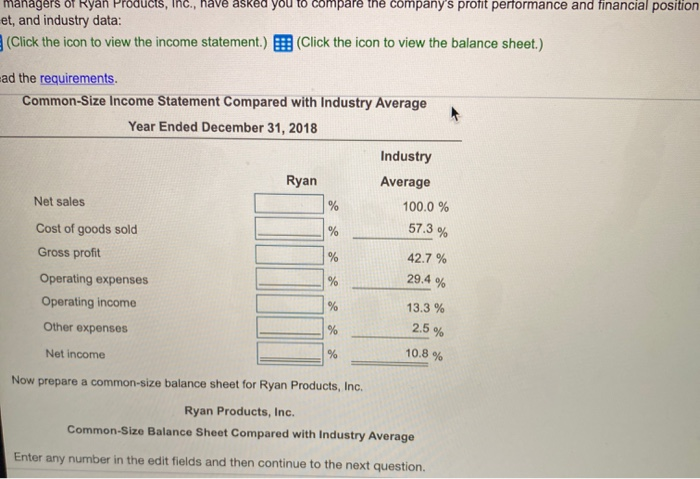
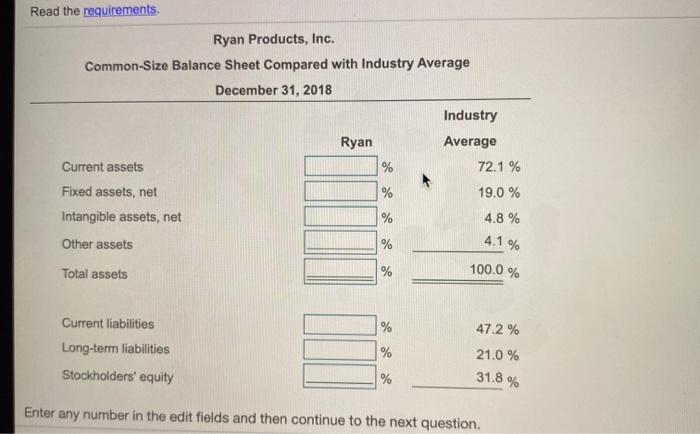
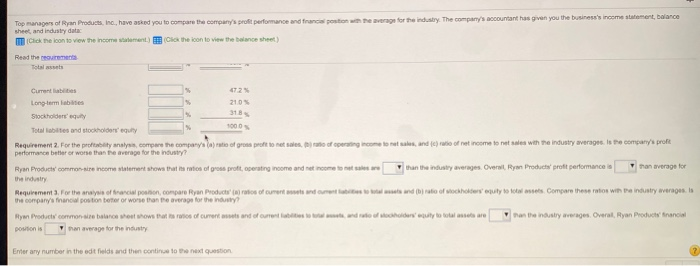
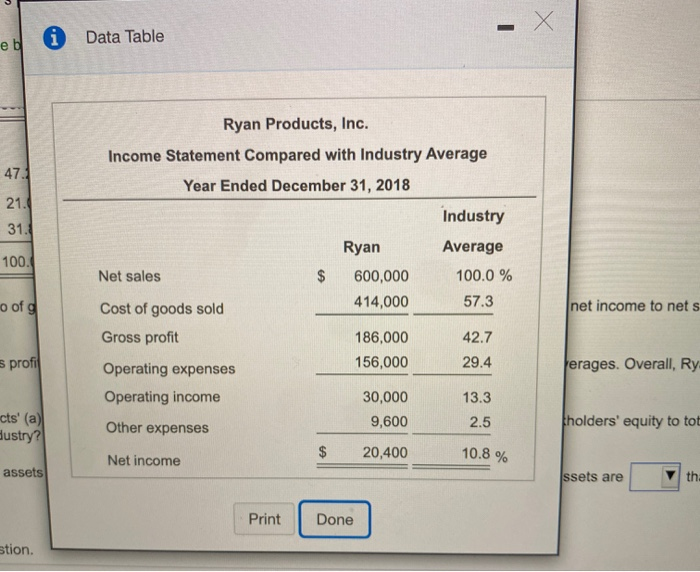
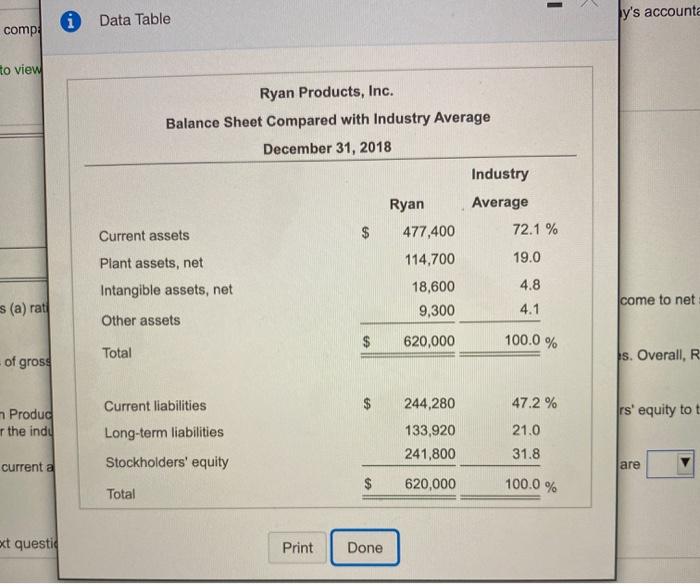
Top managers of Ryan Products, inc., have asked you to compare the company's profit performance and fnancial postion with the average for the industry. The company's accountant has given you the business's income statement, balance shest, and industry data: the loon to view the income statement) cick then to view the balance sheet) Read moments Requirement 1. Prepare a common se income statement and balance sheet for Ryan Products. The first column of each ment should present the company's common size statement, and the second column should show the most werages Pound the percentages to the nearestone-lenthet, XX%) Start by preparing a common size income statement for Ryan Products, inc. Ryan Products, in Conmonste income Statement Compared with industry Average Yew Ended December 31, 2018 Industry Average News 1000 Cost of goods so Croft 427 Operating expenses Operating income 133 2.5 Enter any number in the editfields and the continue totestion managers of Ryan Products, Inc., have asked you to compare the company's profit performance and financial position et, and industry data: (Click the icon to view the income statement.) (Click the icon to view the balance sheet.) ad the requirements. Common-Size Income Statement Compared with Industry Average Year Ended December 31, 2018 Industry Ryan Average Net sales % 100.0 % Cost of goods sold % Gross profit % 42.7 % Operating expenses % Operating income % 13.3 % Other expenses % 57.3 % 29.4 % 2.5 % Net income % 10.8 % Now prepare a common-size balance sheet for Ryan Products, Inc. Ryan Products, Inc. Common-Size Balance Sheet Compared with Industry Average Enter any number in the edit fields and then continue to the next question. Read the requirements. Ryan Products, Inc. Common-Size Balance Sheet Compared with Industry Average December 31, 2018 Industry Average Ryan % 72.1 % % Current assets Fixed assets, net Intangible assets, net Other assets 19.0 % 4.8 % % % 4.1% Total assets 100.0 % % Current liabilities Long-term liabilities 47.2 % % 21.0 % Stockholders' equity % 31.8 % Enter any number in the edit fields and then continue to the next question. Top manager of Ryan Products, Inc., have asked you to compare the company's profit performance and franc potion team for the industry. The company's countant has given you the business's income statement, balance sheet and industry data Click the icon to view the income me.) Click the icon to view the balance sheet Read the reme Current dates Long-term labies 210% Stockholders equity Totalt and stockholders' equity Requirement 2. For the probity analysis, compare the companys la ratio of gross profonet si ate of operating income to metals, and c) of net income to not sale with the industry averages is the company's proft performance batter or worse than the average for the industry? Ryan Products common are income talent shows that is its of gros proft, operating income and retrom than the industry averages Overall, Ryan Product Brott performance is than average for Requirement. For the anaysia of tractat ponion, compare Ryan Production rates of curent and come talets and (tool ochoreputy to tots els compare these to win Pa Industry averages.is the company's financial position beter or worse than the average for the industry Fy Productor common alto balance sheet wow that to ratio of cuvent assets and of content tables a ww ws and to holder outy to total wat we antensywverages Overall, Ryan Products Anancial nan average for the housty position is Enter any number in the edit fields and then continue to the next question . X Data Table 471 21. 31. 100. Ryan Products, Inc. Income Statement Compared with Industry Average Year Ended December 31, 2018 Industry Ryan Average Net sales $ 600,000 100.0 % 414,000 57.3 Cost of goods sold Gross profit 186,000 42.7 156,000 29.4 Operating expenses Operating income 30,000 13.3 Other expenses 9,600 2.5 Net income 20,400 o of net income to nets s profil Yerages. Overall, Ry- cts' (a) Austry? holders' equity to tot 10.8 % assets ssets are th Print Done stion. - Data Table Jy's accounta comp: to view Ryan Products, Inc. Balance Sheet Compared with Industry Average December 31, 2018 Industry Ryan Average Current assets 477,400 72.1 % Plant assets, net 114,700 19.0 Intangible assets, net 18,600 4.8 9,300 4.1 Other assets 620,000 Total come to net s (a) rati 100.0 % of gross s. Overall, R Current liabilities $ 47.2 % rs' equity to t Produd r the indu Long-term liabilities 244,280 133,920 241,800 620,000 21.0 31.8 current a Stockholders' equity are $ 100.0 % Total ext questi Print Done
