

Question: topic data warehouse Table 2.0 below shows the representation of sales amount for Suria Sdn Bhd company according to the type of items for January
topic data warehouse
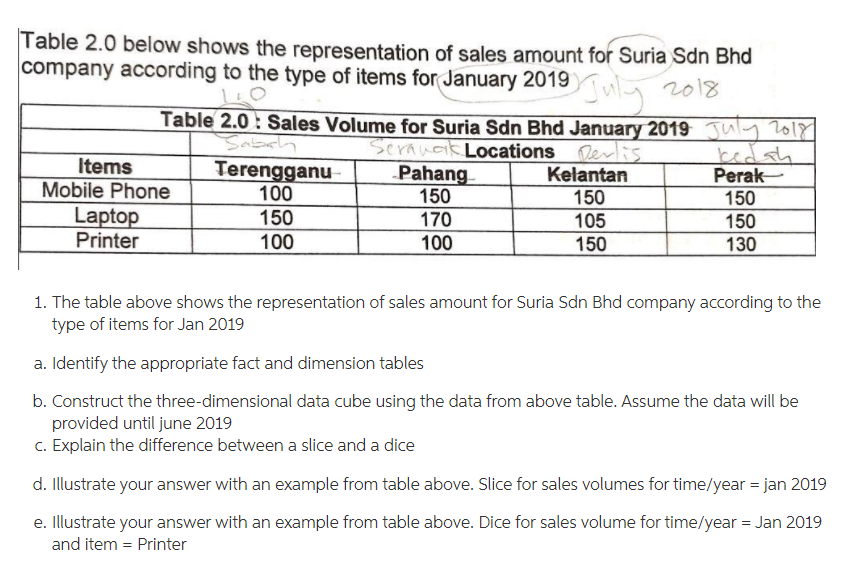
Table 2.0 below shows the representation of sales amount for Suria Sdn Bhd company according to the type of items for January 2013 July 2018 Table 2.0 : Sales Volume for Suria Sdn Bhd January 2019 July 2017 Sabah Serancis Locations Perlis Items Terengganu Pahang Kelantan Perak Mobile Phone 100 150 150 150 Laptop 150 170 105 150 Printer 100 100 150 130 1. The table above shows the representation of sales amount for Suria Sdn Bhd company according to the type of items for Jan 2019 a. Identify the appropriate fact and dimension tables b. Construct the three-dimensional data cube using the data from above table. Assume the data will be provided until june 2019 c. Explain the difference between a slice and a dice d. Illustrate your answer with an example from table above. Slice for sales volumes for time/year = jan 2019 e. Illustrate your answer with an example from table above. Dice for sales volume for time/year = Jan 2019 and item = Printer
Step by Step Solution
There are 3 Steps involved in it

Get step-by-step solutions from verified subject matter experts