Answered step by step
Verified Expert Solution
Question
1 Approved Answer
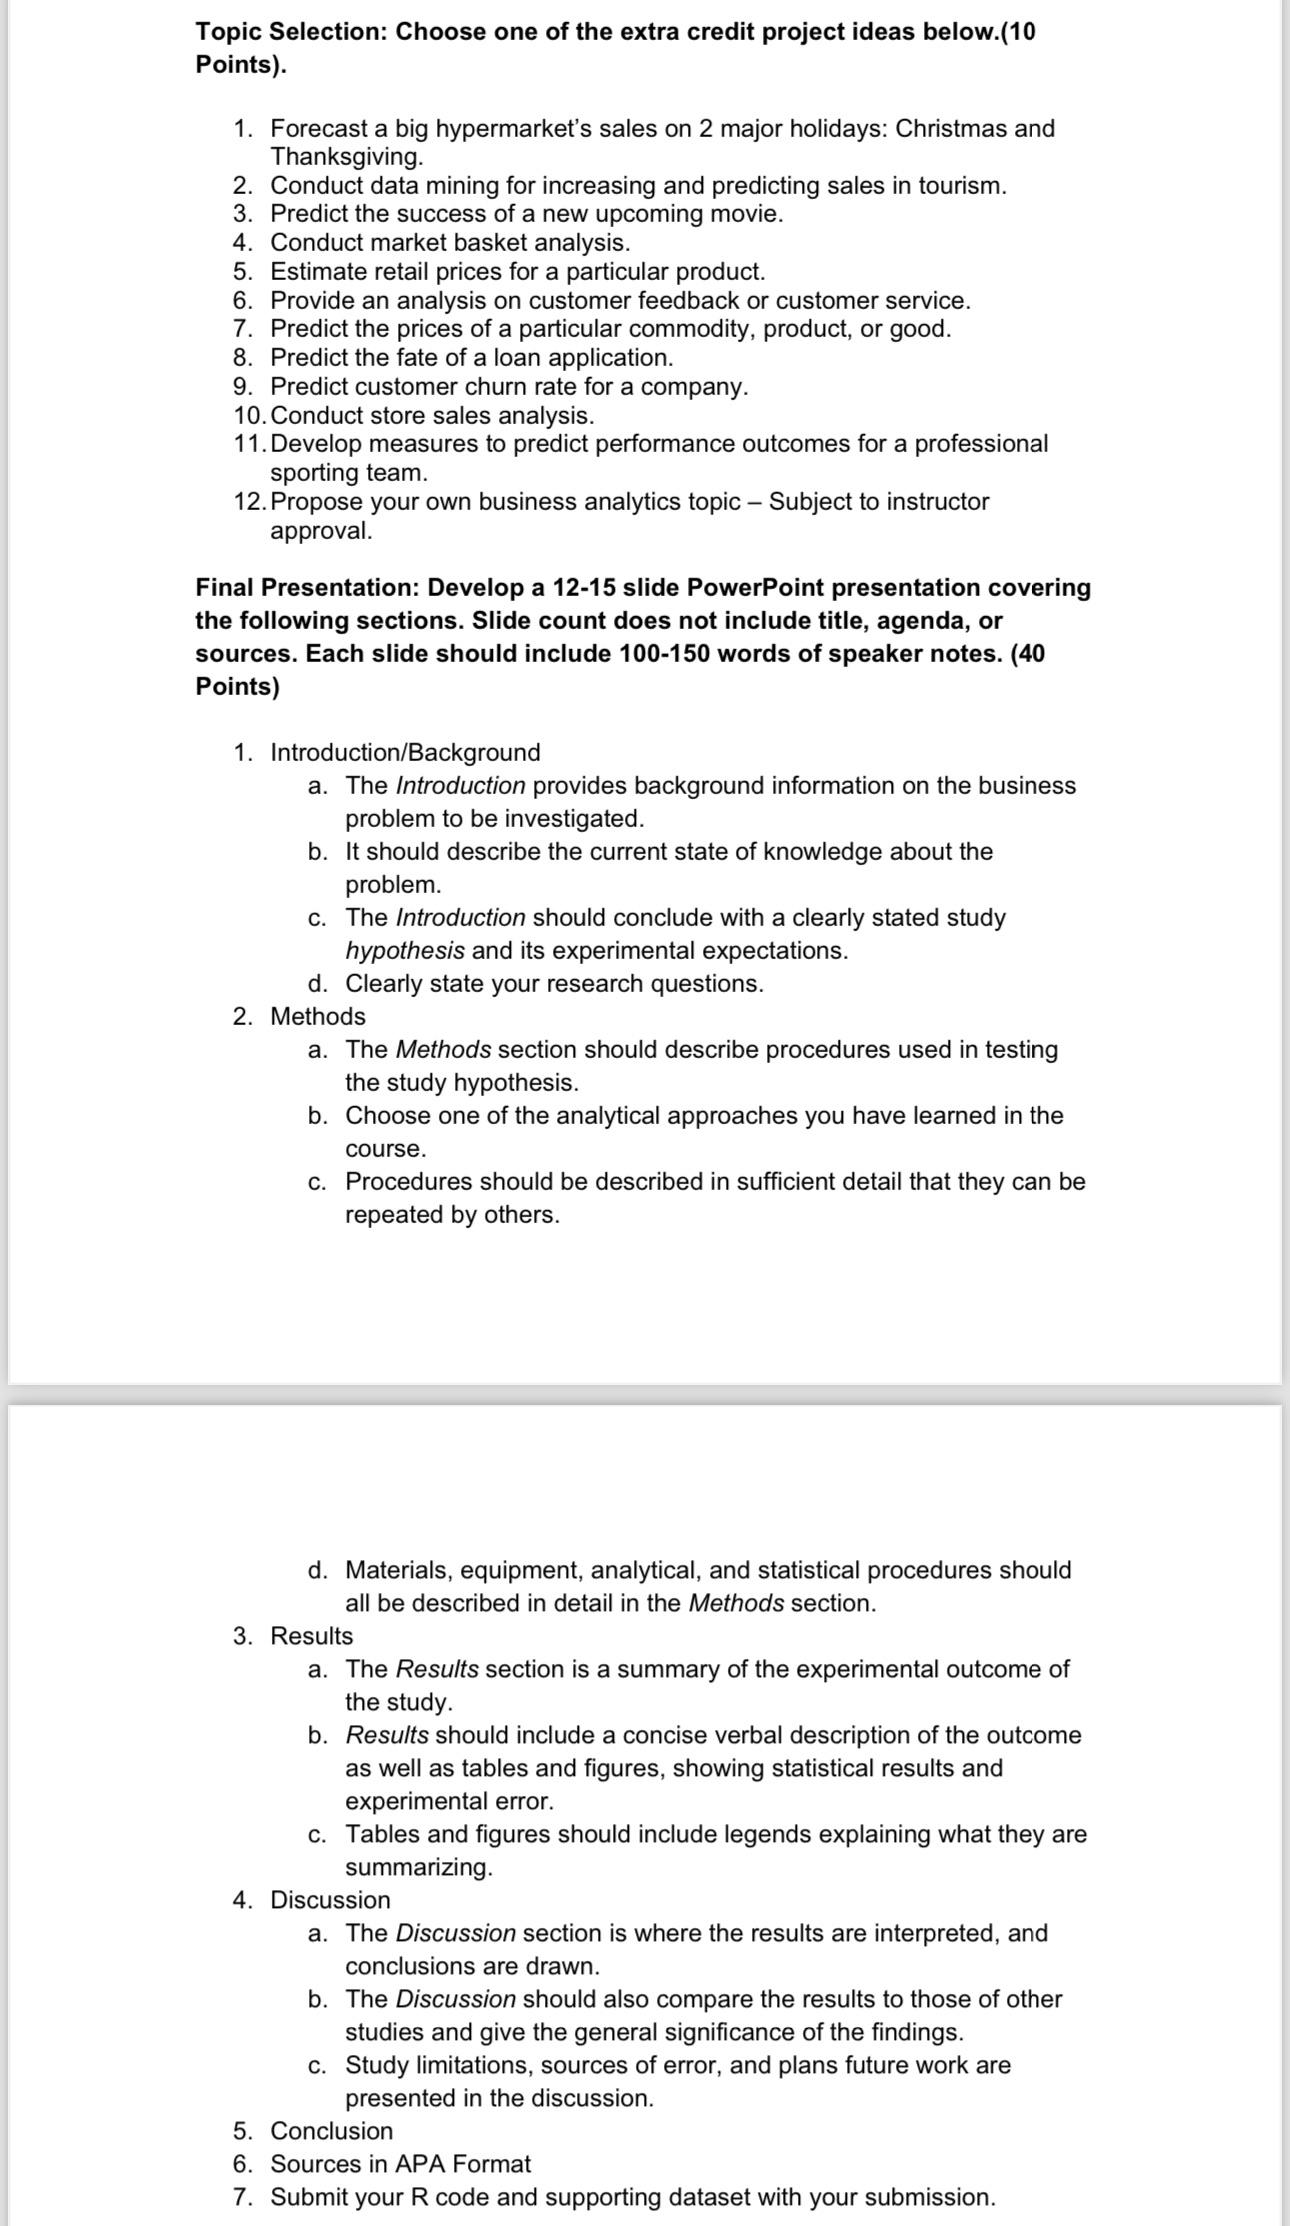
Topic Selection: Choose one of the extra credit project ideas below. (10 Points). 1. Forecast a big hypermarket's sales on 2 major holidays: Christmas

Topic Selection: Choose one of the extra credit project ideas below. (10 Points). 1. Forecast a big hypermarket's sales on 2 major holidays: Christmas and Thanksgiving. 2. Conduct data mining for increasing and predicting sales in tourism. 3. Predict the success of a new upcoming movie. 4. Conduct market basket analysis. 5. Estimate retail prices for a particular product. 6. Provide an analysis on customer feedback or customer service. 7. Predict the prices of a particular commodity, product, or good. 8. Predict the fate of a loan application. 9. Predict customer churn rate for a company. 10. Conduct store sales analysis. 11. Develop measures to predict performance outcomes for a professional sporting team. 12. Propose your own business analytics topic - Subject to instructor approval. Final Presentation: Develop a 12-15 slide PowerPoint presentation covering the following sections. Slide count does not include title, agenda, or sources. Each slide should include 100-150 words of speaker notes. (40 Points) 1. Introduction/Background a. The Introduction provides background information on the business problem to be investigated. b. It should describe the current state of knowledge about the problem. c. The Introduction should conclude with a clearly stated study hypothesis and its experimental expectations. d. Clearly state your research questions. 2. Methods a. The Methods section should describe procedures used in testing the study hypothesis. b. Choose one of the analytical approaches you have learned in the course. c. Procedures should be described in sufficient detail that they can be repeated by others. d. Materials, equipment, analytical, and statistical procedures should all be described in detail in the Methods section. 3. Results a. The Results section is a summary of the experimental outcome of the study. b. Results should include a concise verbal description of the outcome as well as tables and figures, showing statistical results and experimental error. c. Tables and figures should include legends explaining what they are summarizing. 4. Discussion a. The Discussion section is where the results are interpreted, and conclusions are drawn. b. The Discussion should also compare the results to those of other studies and give the general significance of the findings. c. Study limitations, sources of error, and plans future work are presented in the discussion. 5. Conclusion 6. Sources in APA Format 7. Submit your R code and supporting dataset with your submission.
Step by Step Solution
There are 3 Steps involved in it
Step: 1

Get Instant Access to Expert-Tailored Solutions
See step-by-step solutions with expert insights and AI powered tools for academic success
Step: 2

Step: 3

Ace Your Homework with AI
Get the answers you need in no time with our AI-driven, step-by-step assistance
Get Started


