Topic :- Statistics and Probability:-
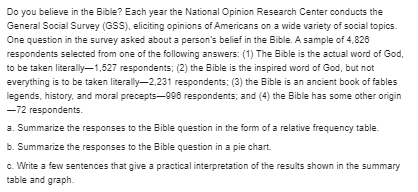
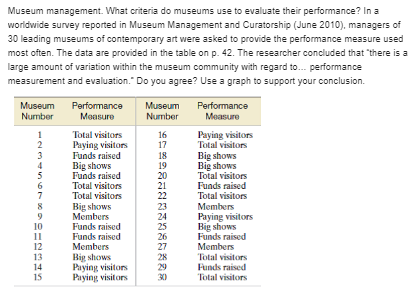
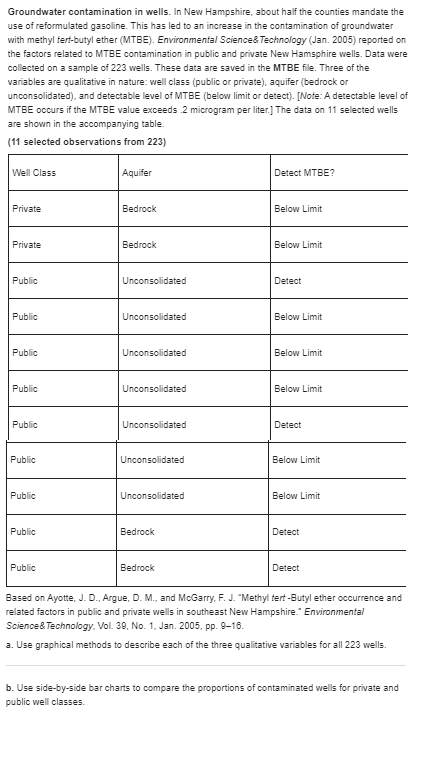
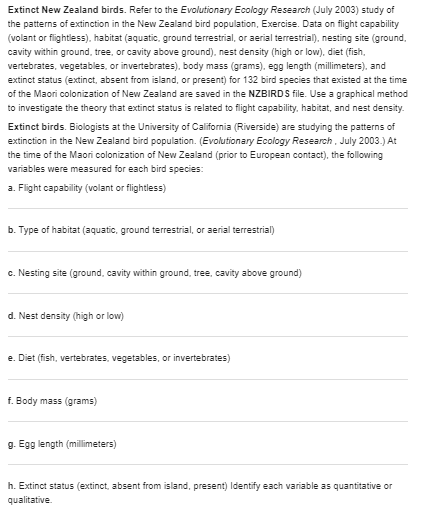
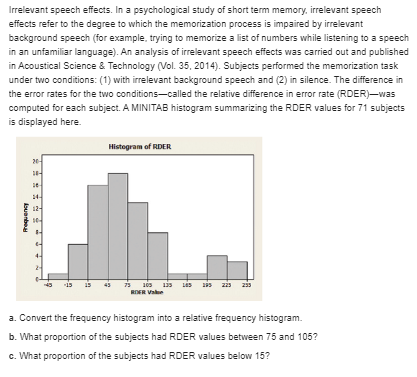
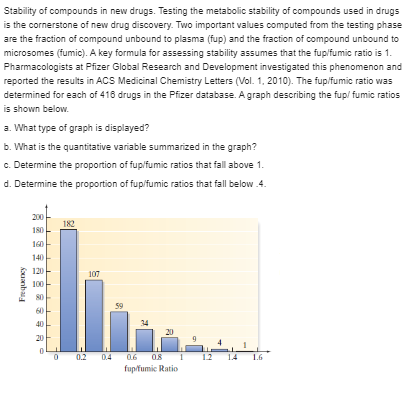
Do you believe in the Bible? Each year the National Opinion Research Center conducts the General Social Survey (GSS), eliciting opinions of Americans on a wide variety of social topics. One question in the survey asked about a person's belief in the Bible. A sample of 4,826 respondents selected from one of the following answers: (1) The Bible is the actual word of God, to be taken literally-1,527 respondents; (2) the Bible is the inspired word of God, but not everything is to be taken literally-2.231 respondents; (3) the Bible is an ancient book of fables legends, history, and moral precepts-906 respondents; and (4) the Bible has some other origin -72 respondents. 3. Summarize the responses to the Bible question in the form of a relative frequency table. b. Summarize the responses to the Bible question in a pie chart. c. Write a few sentences that give a practical interpretation of the results shown in the summary table and graph.Museum management. What criteria do museums use to evaluate their performance? In a worldwide survey reported in Museum Management and Curatorship (June 2010), managers of 30 leading museums of contemporary art were asked to provide the performance measure used most often. The data are provided in the table on p. 42. The researcher concluded that there is a large amount of variation within the museum community with regard to... performance measurement and evaluation." Do you agree? Use a graph to support your conclusion. Museum Performance Museum Performance Number Measure Number Total visitors 16 Paying visitors Paying visitors 17 Total visitors Funds raised 18 Big shows Big shows 19 Big shows Funds raised 20 Total visitors Total visitors 21 Funds raised Total visitors 21 Total visitors Big shows Members Members 24 Paying visitors 10 Funds raised 25 Big shows Funds raised 26 Funds raised 12 Members 27 Members 13 Big shows Total visitors 14 Paying visitors Funds raised 15 Paying visitors 30 Total visitorsGroundwater contamination in wells. In New Hampshire, about half the counties mandate the use of reformulated gasoline. This has led to an increase in the contamination of groundwater with methyl ferf-butyl ether (MTBE). Environmental Science& Technology (Jan. 2005) reported on the factors related to MTBE contamination in public and private New Hamsphire wells. Data were collected on a sample of 223 wells. These data are saved in the MTBE file. Three of the variables are qualitative in nature: well class (public or private), aquifer (bedrock or unconsolidated). and detectable level of MTBE (below limit or detect). [Note: A detectable level of MTBE occurs if the MTBE value exceeds .2 microgram per liter.] The data on 11 selected wells are shown in the accompanying table (11 selected observations from 223] We'll Class Aquifer Detect MTBE? Private Bedrock Below Limit Private Bedrock Below Limit Public Unconsolidated Detect Public Unconsolidated Below Limit Public Unconsolidated Below Limit Public Unconsolidated Below Limit Public Unconsolidated Detect Public Unconsolidated Below Limit Public Unconsolidated Below Limit Public Bedrock Detect Public Bedrock Detect Based on Ayotte, J. D., Argue, D. M., and McGarry, F. J. "Methyl tert -Butyl ether occurrence and related factors in public and private wells in southeast New Hampshire." Environmental Science & Technology. Vol 30, No. 1, Jan. 2005, pp. 9-16. a. Use graphical methods to describe each of the three qualitative variables for all 223 wells. b. Use side-by-side bar charts to compare the proportions of contaminated wells for private and public well classes.Extinct New Zealand birds. Refer to the Evolutionary Ecology Research (July 2003) study of the patterns of extinction in the New Zealand bird population, Exercise. Data on flight capability (volant or flightless). habitat (aquatic, ground terrestrial, or aerial terrestrial), nesting site (ground, cavity within ground, tree, or cavity above ground). nest density (high or low), diet (fish, vertebrates, vegetables, or invertebrates), body mass (grams). egg length (millimeters), and extinct status (extinct, absent from island, or present) for 132 bird species that existed at the time of the Maori colonization of New Zealand are saved in the NZBIRDS file. Use a graphical method to investigate the theory that extinct status is related to flight capability, habitat, and nest density. Extinct birds. Biologists at the University of California (Riverside) are studying the patterns of extinction in the New Zealand bird population. (Evolutionary Ecology Research , July 2003.) At the time of the Maori colonization of New Zealand (prior to European contact), the following variables were measured for each bird species: a. Flight capability (volant or flightless) b. Type of habitat (aquatic, ground terrestrial, or aerial terrestrial) C. Nesting site (ground, cavity within ground, tree, cavity above ground) d. Nest density (high or low) e. Diet (fish, vertebrates, vegetables, or invertebrates) f. Body mass (grams) g. Egg length (millimeters) h. Extinct status (extinct, absent from island, present) Identify each variable as quantitative or qualitative.Consider the MINITAB histogram shown below. Histogram of Value 12 a. Is this a frequency histogram or a relative frequency histogram? Explain. b. How many class intervals were used in the construction of this histogram? c. How many measurements are there in the data set described by this histogram?Consider the stem-and-leaf display shown here: Stem Leaf 51 1 457 3 00038 2 1134598 2248 012 3. How many observations were in the original data set? b. In the bottom row of the stem-and-leaf display, identify the stem, the leaves, and the numbers in the original data set represented by this stem and its leaves. c. Re-create all the numbers in the data set, and construct a dot plot.\f\f\f\fCorporate sustainability of CPA firms. Refer to the Business and Society (Mar. 2011) study on the sustainability behaviors of CPA corporations, Exercise 1.28 (p. 22). Recall that corporate sustainability refers to business practices designed around social and environmental considerations. Data on the level of support for corporate sustainability were obtained for 902 senior managers. Level of support was measured quantitatively. Simulation was used to convert the data from the study to a scale ranging from 0 to 180 points, where higher point values indicate a higher level of support for sustainability. 3. A histogram for level of support for sustainability is shown below. What type of histogram is produced, frequency or relative frequency? b. Use the graph to estimate the percentage of the 092 senior managers who reported a high (100 points or greater) level of support for corporate sustainability. Faroint 100 130 140 Support Level [Reference Exercise 1.26) Corporate sustainability. Corporate sustainability refers to business practices designed around social and environmental considerations (e g.. "going green"). Business and Society (Mar. 2011) published a paper on how firm size and firm type affect sustainability behaviors. A survey was sent to approximately 23,500 senior managers at OPA firms, of which 1 293 senior managers responded. (Note: It is not clear how the 23,500 senior managers were selected.) Due to missing data (incomplete survey answers), only 092 surveys were analyzed. These data were used to infer whether larger firms are more likely to report sustainability policies than smaller firms and whether public firms are more likely to report sustainability policies than private firms. 3. Identify the population of interest to the researchers. b. What method was used to collect the sample data? c. Comment on the representativeness of the sample