

Answered step by step
Verified Expert Solution
Question
1 Approved Answer
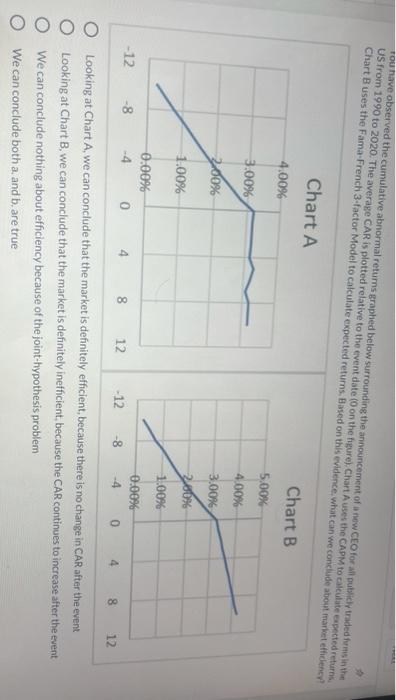
Tourave observed the cumulative abnormal returns graphed below surrounding the announcement of a new CEO for all publicly traded forms in the US from 1990
Step by Step Solution
There are 3 Steps involved in it
Step: 1

Get Instant Access to Expert-Tailored Solutions
See step-by-step solutions with expert insights and AI powered tools for academic success
Step: 2

Step: 3
Ace Your Homework with AI
Get the answers you need in no time with our AI-driven, step-by-step assistance
Get Started
Day Trading Strategies And Risk Management
Authors: Richard N. Williams
1st Edition
979-8863610528