

Answered step by step
Verified Expert Solution
Question
1 Approved Answer
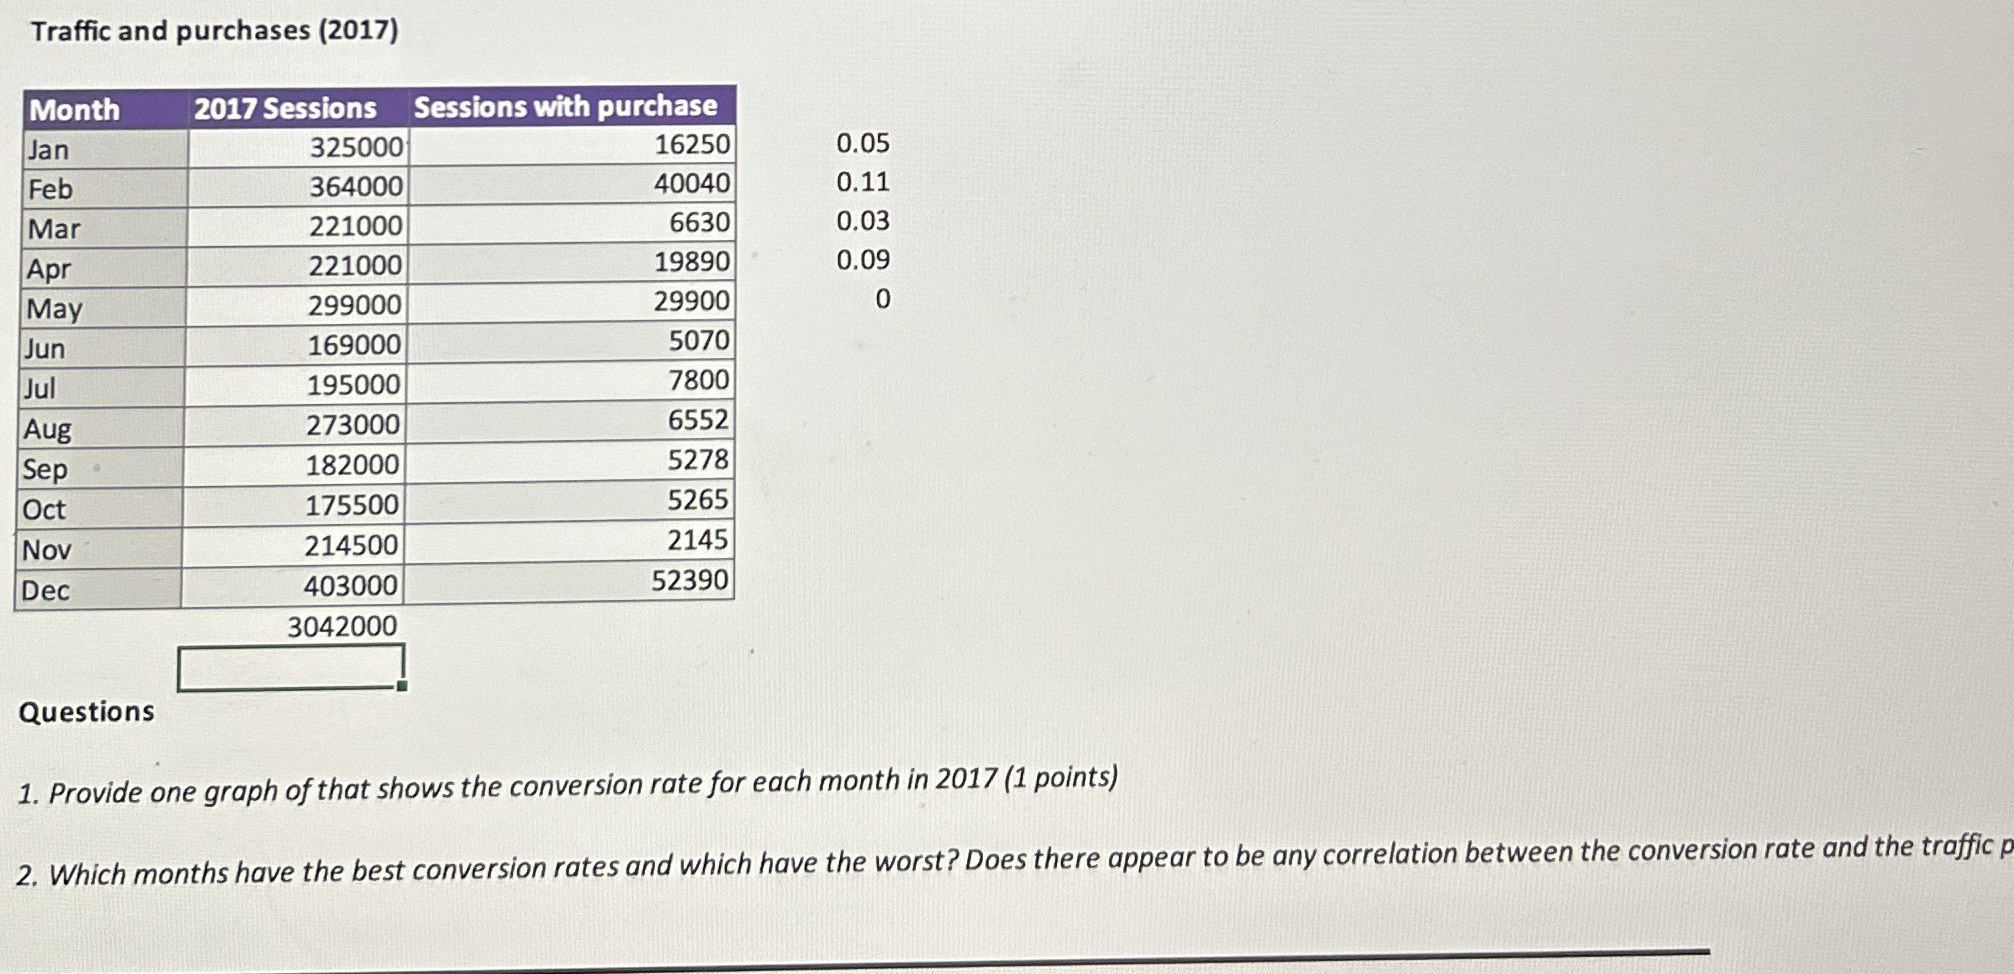
Traffic and purchases ( 2 0 1 7 ) table [ [ Month , 2 0 1 7 Sessions,Sessions with purchase ] , [
Traffic and purchases
tableMonth Sessions,Sessions with purchaseJanFebMarAprMayJunJulAugSepOctNovDec
Questions
Provide one graph of that shows the conversion rate for each month in points
Which months have the best conversion rates and which have the worst? Does there appear to be any correlation between the conversion rate and the traffic
Step by Step Solution
There are 3 Steps involved in it
Step: 1

Get Instant Access to Expert-Tailored Solutions
See step-by-step solutions with expert insights and AI powered tools for academic success
Step: 2

Step: 3
Ace Your Homework with AI
Get the answers you need in no time with our AI-driven, step-by-step assistance
Get Started
Accounting
Authors: Carl s. warren, James m. reeve, Philip e. fess
21st Edition
978-0324400205, 324225016, 324188005, 324400209, 9780324225013, 978-0324188004