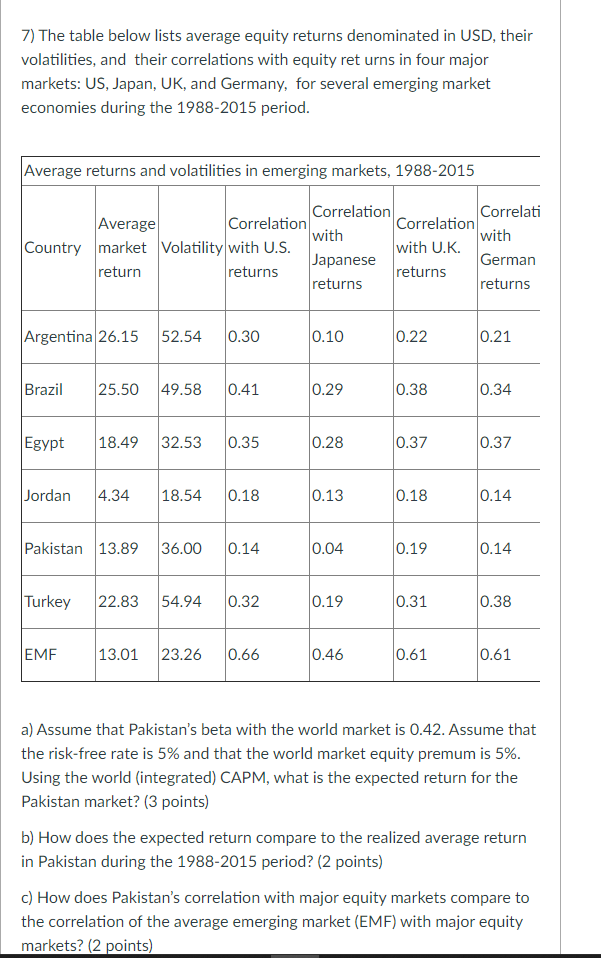

7) The table below lists average equity returns denominated in USD, their volatilities, and their correlations with equity returns in four major markets: US, Japan, UK, and Germany, for several emerging market economies during the 1988-2015 period. Average returns and volatilities in emerging markets, 1988-2015 Correlation Correlati Average Correlation Correlation with with Country market Volatility with U.S. with U.K. Japanese German return returns returns returns returns Argentina 26.15 52.54 0.30 0.10 0.22 0.21 Brazil 25.50 49.58 0.41 0.29 0.38 0.34 Egypt 18.49 32.53 0.35 0.28 0.37 0.37 Jordan 4.34 18.54 0.18 0.13 0.18 0.14 Pakistan 13.89 36.00 0.14 0.04 0.19 0.14 Turkey 22.83 54.94 0.32 0.19 0.31 0.38 EME 13.01 23.26 0.66 0.46 0.61 0.61 a) Assume that Pakistan's beta with the world market is 0.42. Assume that the risk-free rate is 5% and that the world market equity premum is 5%. Using the world (integrated) CAPM, what is the expected return for the Pakistan market? (3 points) b) How does the expected return compare to the realized average return in Pakistan during the 1988-2015 period? (2 points) c) How does Pakistan's correlation with major equity markets compare to the correlation of the average emerging market (EMF) with major equity markets? (2 points) 7) The table below lists average equity returns denominated in USD, their volatilities, and their correlations with equity returns in four major markets: US, Japan, UK, and Germany, for several emerging market economies during the 1988-2015 period. Average returns and volatilities in emerging markets, 1988-2015 Correlation Correlati Average Correlation Correlation with with Country market Volatility with U.S. with U.K. Japanese German return returns returns returns returns Argentina 26.15 52.54 0.30 0.10 0.22 0.21 Brazil 25.50 49.58 0.41 0.29 0.38 0.34 Egypt 18.49 32.53 0.35 0.28 0.37 0.37 Jordan 4.34 18.54 0.18 0.13 0.18 0.14 Pakistan 13.89 36.00 0.14 0.04 0.19 0.14 Turkey 22.83 54.94 0.32 0.19 0.31 0.38 EME 13.01 23.26 0.66 0.46 0.61 0.61 a) Assume that Pakistan's beta with the world market is 0.42. Assume that the risk-free rate is 5% and that the world market equity premum is 5%. Using the world (integrated) CAPM, what is the expected return for the Pakistan market? (3 points) b) How does the expected return compare to the realized average return in Pakistan during the 1988-2015 period? (2 points) c) How does Pakistan's correlation with major equity markets compare to the correlation of the average emerging market (EMF) with major equity markets? (2 points) 7) The table below lists average equity returns denominated in USD, their volatilities, and their correlations with equity returns in four major markets: US, Japan, UK, and Germany, for several emerging market economies during the 1988-2015 period. Average returns and volatilities in emerging markets, 1988-2015 Correlation Correlati Average Correlation Correlation with with Country market Volatility with U.S. with U.K. Japanese German return returns returns returns returns Argentina 26.15 52.54 0.30 0.10 0.22 0.21 Brazil 25.50 49.58 0.41 0.29 0.38 0.34 Egypt 18.49 32.53 0.35 0.28 0.37 0.37 Jordan 4.34 18.54 0.18 0.13 0.18 0.14 Pakistan 13.89 36.00 0.14 0.04 0.19 0.14 Turkey 22.83 54.94 0.32 0.19 0.31 0.38 EME 13.01 23.26 0.66 0.46 0.61 0.61 a) Assume that Pakistan's beta with the world market is 0.42. Assume that the risk-free rate is 5% and that the world market equity premum is 5%. Using the world (integrated) CAPM, what is the expected return for the Pakistan market? (3 points) b) How does the expected return compare to the realized average return in Pakistan during the 1988-2015 period? (2 points) c) How does Pakistan's correlation with major equity markets compare to the correlation of the average emerging market (EMF) with major equity markets? (2 points) 7) The table below lists average equity returns denominated in USD, their volatilities, and their correlations with equity returns in four major markets: US, Japan, UK, and Germany, for several emerging market economies during the 1988-2015 period. Average returns and volatilities in emerging markets, 1988-2015 Correlation Correlati Average Correlation Correlation with with Country market Volatility with U.S. with U.K. Japanese German return returns returns returns returns Argentina 26.15 52.54 0.30 0.10 0.22 0.21 Brazil 25.50 49.58 0.41 0.29 0.38 0.34 Egypt 18.49 32.53 0.35 0.28 0.37 0.37 Jordan 4.34 18.54 0.18 0.13 0.18 0.14 Pakistan 13.89 36.00 0.14 0.04 0.19 0.14 Turkey 22.83 54.94 0.32 0.19 0.31 0.38 EME 13.01 23.26 0.66 0.46 0.61 0.61 a) Assume that Pakistan's beta with the world market is 0.42. Assume that the risk-free rate is 5% and that the world market equity premum is 5%. Using the world (integrated) CAPM, what is the expected return for the Pakistan market? (3 points) b) How does the expected return compare to the realized average return in Pakistan during the 1988-2015 period? (2 points) c) How does Pakistan's correlation with major equity markets compare to the correlation of the average emerging market (EMF) with major equity markets? (2 points)