Answered step by step
Verified Expert Solution
Question
1 Approved Answer
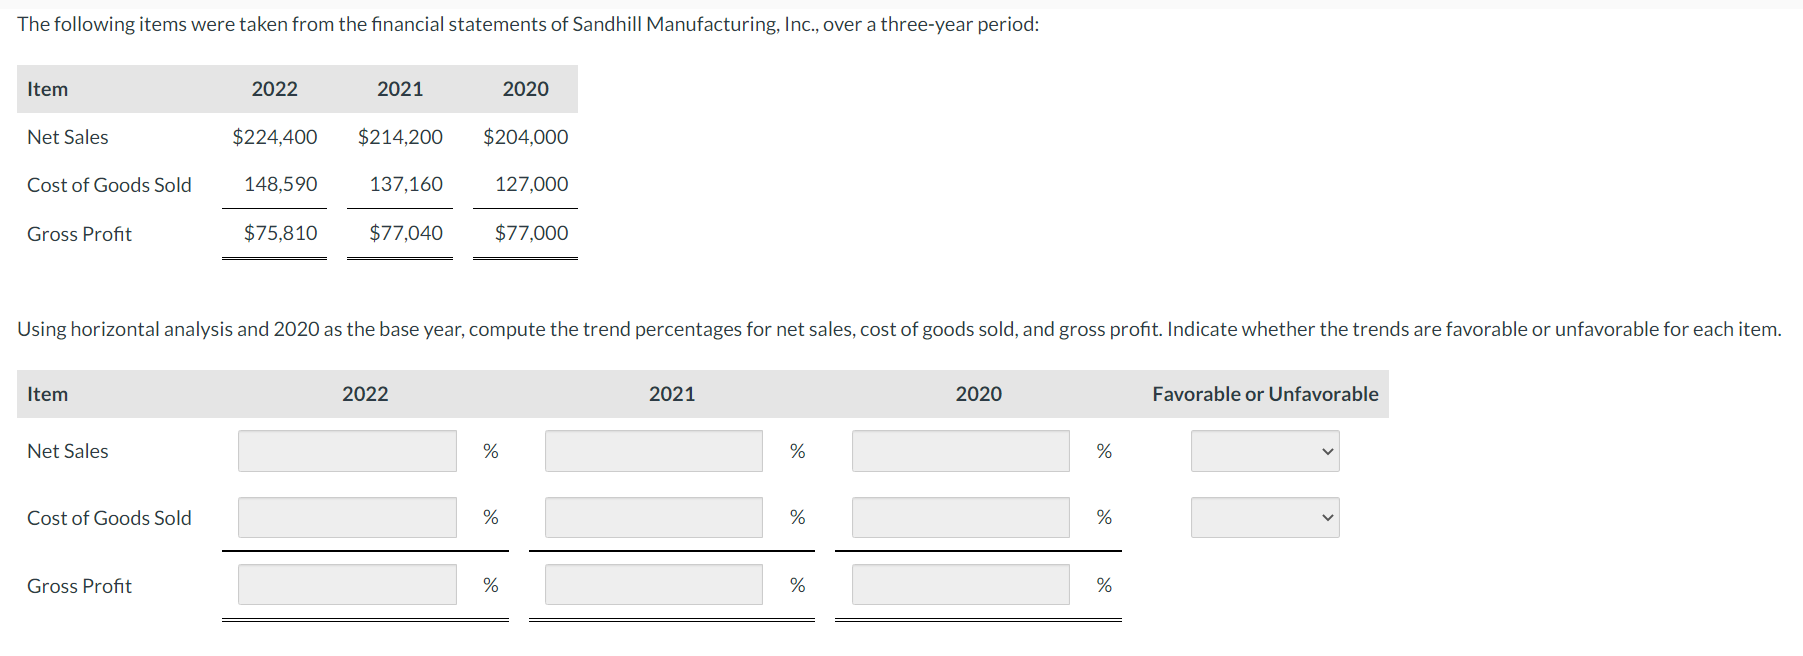
The following items were taken from the financial statements of Sandhill Manufacturing, Inc., over a three-year period: Item 2022 2021 2020 Net Sales $224,400

The following items were taken from the financial statements of Sandhill Manufacturing, Inc., over a three-year period: Item 2022 2021 2020 Net Sales $224,400 $214,200 $204,000 Cost of Goods Sold 148,590 137,160 127,000 Gross Profit $75,810 $77,040 $77,000 Using horizontal analysis and 2020 as the base year, compute the trend percentages for net sales, cost of goods sold, and gross profit. Indicate whether the trends are favorable or unfavorable for each item. Item Net Sales Cost of Goods Sold Gross Profit 2022 % % 2021 % % 2020 % % % % % Favorable or Unfavorable
Step by Step Solution
★★★★★
3.36 Rating (152 Votes )
There are 3 Steps involved in it
Step: 1
To compute the trend percentages for net sales cost of goods sold and gross profit using horizontal analysis with 2020 as the base year you will need ...
Get Instant Access to Expert-Tailored Solutions
See step-by-step solutions with expert insights and AI powered tools for academic success
Step: 2

Step: 3

Ace Your Homework with AI
Get the answers you need in no time with our AI-driven, step-by-step assistance
Get Started


