

Answered step by step
Verified Expert Solution
Question
1 Approved Answer
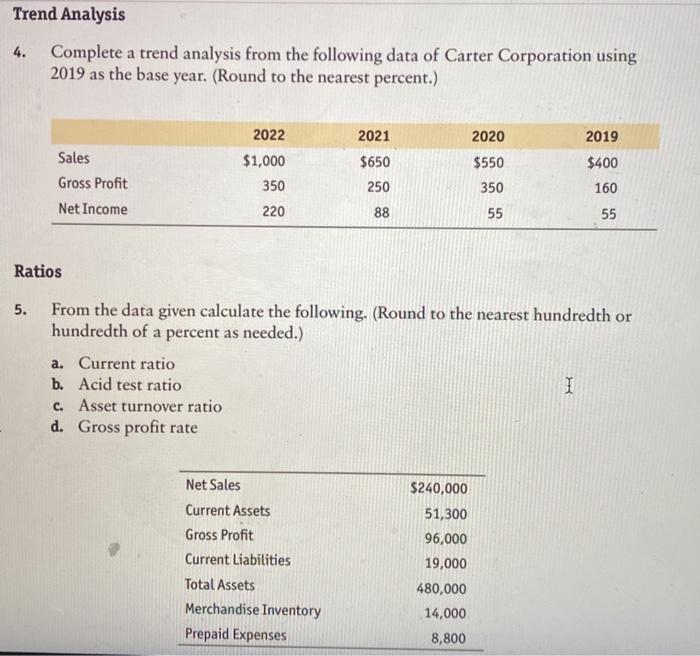
Trend Analysis 4. Complete a trend analysis from the following data of Carter Corporation using 2019 as the base year. (Round to the nearest percent.)
Step by Step Solution
There are 3 Steps involved in it
Step: 1

Get Instant Access to Expert-Tailored Solutions
See step-by-step solutions with expert insights and AI powered tools for academic success
Step: 2

Step: 3
Ace Your Homework with AI
Get the answers you need in no time with our AI-driven, step-by-step assistance
Get Started
Financial Accounting Tools for Business Decision Making
Authors: Jerry J. Weygandt, Paul D. Kimmel, Donald E. Kieso
5th Edition
9781118560952, 1118560957, 978-0470239803