

Answered step by step
Verified Expert Solution
Question
1 Approved Answer
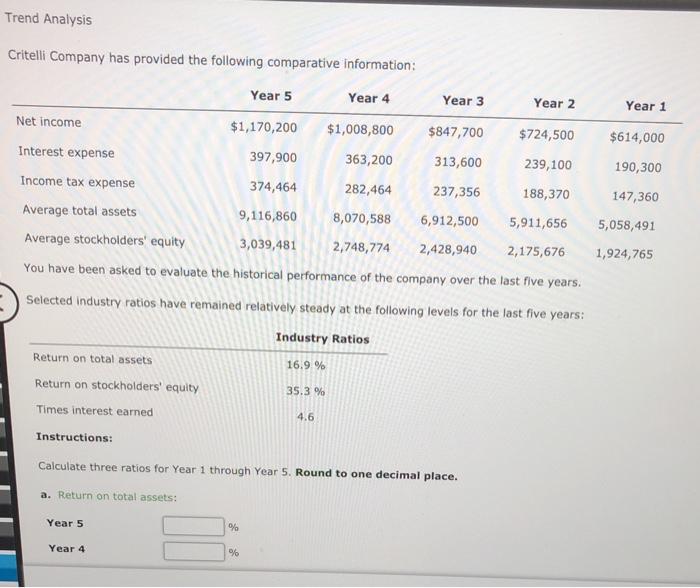
Trend Analysis Critelli Company has provided the following comparative information: Year 1 $614,000 190,300 147,360 5,058,491 Year 5 Year 4 Year 3 Year 2 Net
Step by Step Solution
There are 3 Steps involved in it
Step: 1

Get Instant Access to Expert-Tailored Solutions
See step-by-step solutions with expert insights and AI powered tools for academic success
Step: 2

Step: 3
Ace Your Homework with AI
Get the answers you need in no time with our AI-driven, step-by-step assistance
Get Started
Modern Analytical Auditing Practical Guidance For Auditors And Accountants
Authors: Thomas Mckee
1st Edition
0899303544, 978-0899303543