Answered step by step
Verified Expert Solution
Question
1 Approved Answer
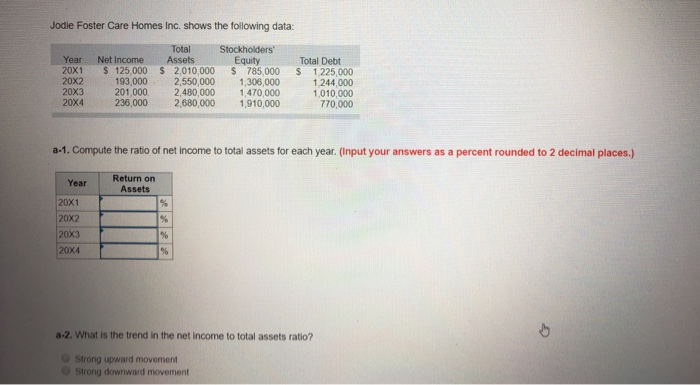
trend analysis Jodie Foster Care Homes Inc. shows the following data: Year 20X1 20X2 20x3 20X4 Net Income $ 125,000 193,000 201,000 236,000 Total Assets
trend analysis 

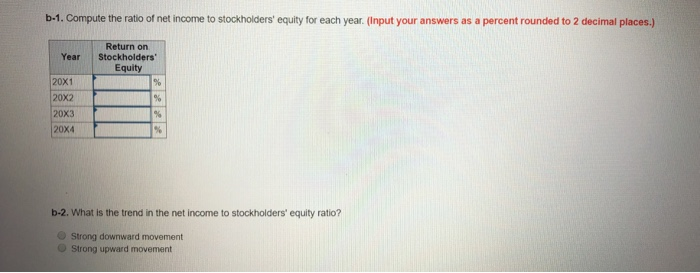
Jodie Foster Care Homes Inc. shows the following data: Year 20X1 20X2 20x3 20X4 Net Income $ 125,000 193,000 201,000 236,000 Total Assets $ 2,010,000 2,550,000 2,480,000 2,680,000 Stockholders Equity $ 785 000 1,306,000 1,470,000 1,910,000 Total Debt $ 1225 000 1.244.000 1010,000 770.000 a-1. Compute the ratio of net income to total assets for each year. (Input your answers as a percent rounded to 2 decimal places.) Year Return on Assets 20X1 20x2 20x3 20X4 3-2. What is the trend in the net income to total assets ratio? Strong upward movement Strong downward movement b-1. Compute the ratio of net income to stockholders' equity for each year. (Input your answers as a percent rounded to 2 decimal places.) Year Return on Stockholders' Equity 20X1 20x2 20X3 20X4 b-2. What is the trend in the net income to stockholders' equity ratio? Strong downward movement Strong upward movement 

Step by Step Solution
There are 3 Steps involved in it
Step: 1

Get Instant Access to Expert-Tailored Solutions
See step-by-step solutions with expert insights and AI powered tools for academic success
Step: 2

Step: 3

Ace Your Homework with AI
Get the answers you need in no time with our AI-driven, step-by-step assistance
Get Started


