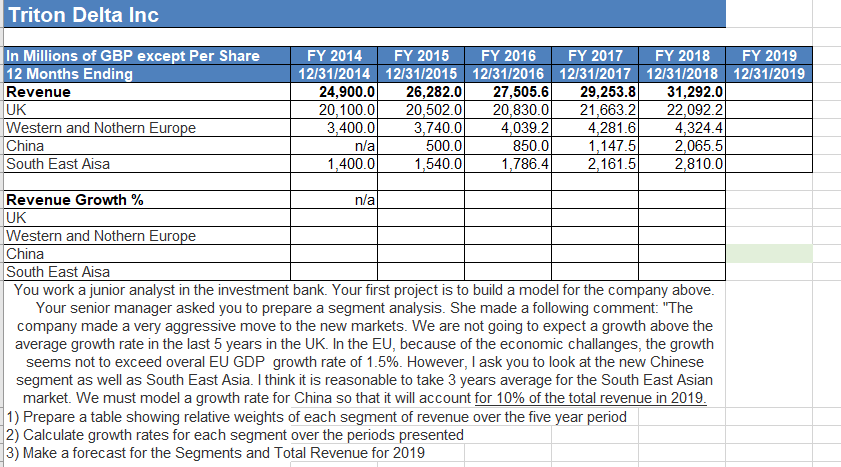
Triton Delta Inc In Millions of GBP except Per Share 12 Months Ending Revenue UK Western and Nothern Europe China South East Aisa FY 2014 FY 2015 FY 2016 FY 2017 FY 2018 FY 2019 12/31/2014 12/31/2015 12/31/2016 12/31/2017 12/31/2018 12/31/2019 24,900.0 26,282.0 27,505.6 29,253.8 31,292.0 20,100.00 20,502.0 20,830.0 21,663.2 22,092.2 3,400.00 3,740.0 4,039.2 4,281.6 4,324.4 n/al 500.00 850.00 1,147.5 2,065.51 1,400.0 1,540.0 1,786.4 2,161.5) 2,810.0 Revenue Growth % n/a UK Western and Nothern Europe China South East Aisa You work a junior analyst in the investment bank. Your first project is to build a model for the company above. Your senior manager asked you to prepare a segment analysis. She made a following comment: "The company made a very aggressive move to the new markets. We are not going to expect a growth above the average growth rate in the last 5 years in the UK. In the EU, because of the economic challanges, the growth seems not to exceed overal EU GDP growth rate of 1.5%. However, I ask you to look at the new Chinese segment as well as South East Asia. I think it is reasonable to take 3 years average for the South East Asian market. We must model a growth rate for China so that it will account for 10% of the total revenue in 2019. 1) Prepare a table showing relative weights of each segment of revenue over the five year period 2) Calculate growth rates for each segment over the periods presented 3) Make a forecast for the Segments and Total Revenue for 2019 Triton Delta Inc In Millions of GBP except Per Share 12 Months Ending Revenue UK Western and Nothern Europe China South East Aisa FY 2014 FY 2015 FY 2016 FY 2017 FY 2018 FY 2019 12/31/2014 12/31/2015 12/31/2016 12/31/2017 12/31/2018 12/31/2019 24,900.0 26,282.0 27,505.6 29,253.8 31,292.0 20,100.00 20,502.0 20,830.0 21,663.2 22,092.2 3,400.00 3,740.0 4,039.2 4,281.6 4,324.4 n/al 500.00 850.00 1,147.5 2,065.51 1,400.0 1,540.0 1,786.4 2,161.5) 2,810.0 Revenue Growth % n/a UK Western and Nothern Europe China South East Aisa You work a junior analyst in the investment bank. Your first project is to build a model for the company above. Your senior manager asked you to prepare a segment analysis. She made a following comment: "The company made a very aggressive move to the new markets. We are not going to expect a growth above the average growth rate in the last 5 years in the UK. In the EU, because of the economic challanges, the growth seems not to exceed overal EU GDP growth rate of 1.5%. However, I ask you to look at the new Chinese segment as well as South East Asia. I think it is reasonable to take 3 years average for the South East Asian market. We must model a growth rate for China so that it will account for 10% of the total revenue in 2019. 1) Prepare a table showing relative weights of each segment of revenue over the five year period 2) Calculate growth rates for each segment over the periods presented 3) Make a forecast for the Segments and Total Revenue for 2019