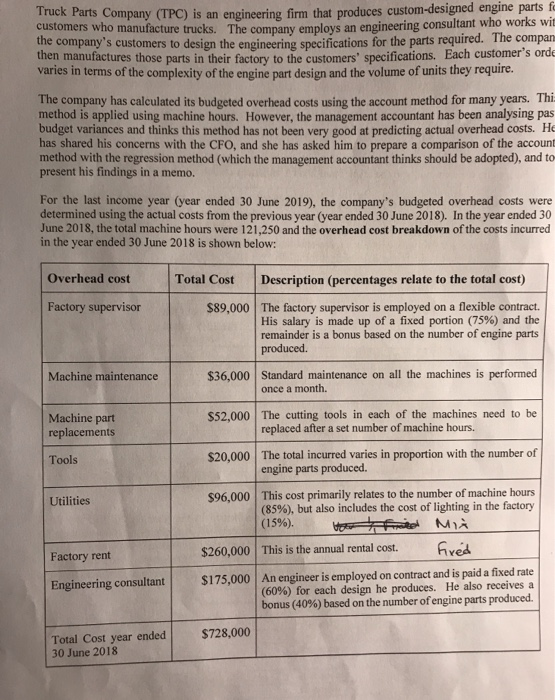
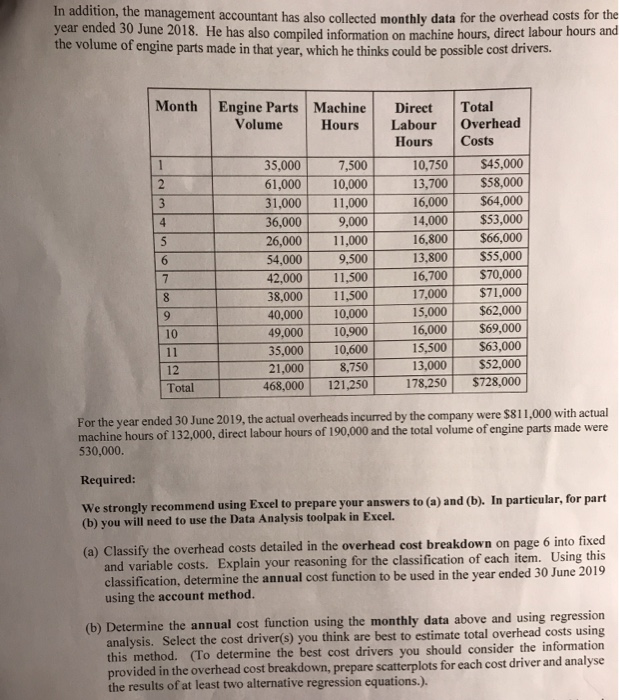
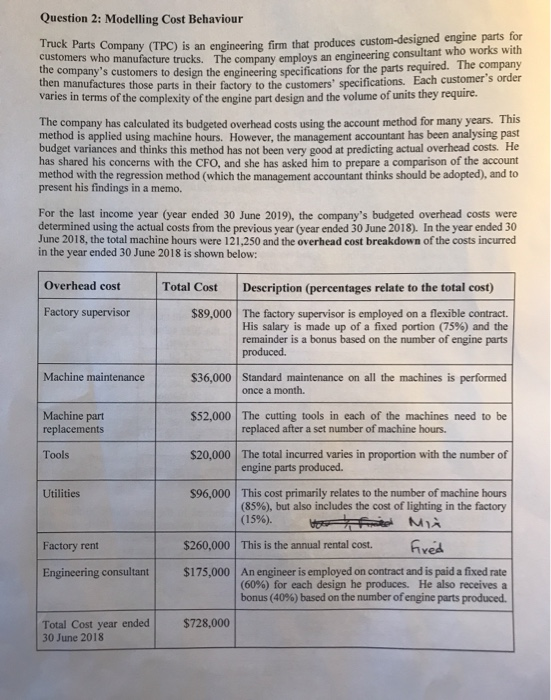
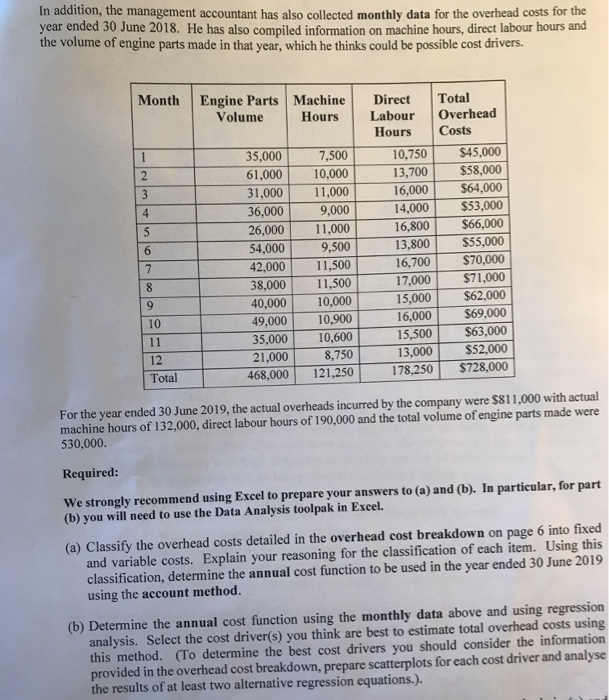
Truck Parts Company (TPC) is an engineering firm that produces custom-designed engine parts fo Customers who manufacture trucks. The company employs an engineering consultant who works wil company s customers to design the engineering snecifications for the parts required. The compan actures those parts in their factory to the customers' specifications. Each customer's orde varies in terms of the complexity of the engine part design and the volume of units they require. The company has calculated its budgeted overhead costs using the account method for many years. Thi method is applied using machine hours. However, the management accountant has been analysing pas budget variances and thinks this method has not been very good at predicting actual overhead costs. He has shared his concerns with the CFO, and she has asked him to prepare a comparison of the account method with the regression method (which the management accountant thinks should be adopted), and to present his findings in a memo. For the last income year (year ended 30 June 2019), the company's budgeted overhead costs were determined using the actual costs from the previous year (year ended 30 June 2018). In the year ended 30 June 2018, the total machine hours were 121,250 and the overhead cost breakdown of the costs incurred in the year ended 30 June 2018 is shown below: Overhead cost Total Cost Description (percentages relate to the total cost) Factory supervisor $89,000 The factory supervisor is employed on a flexible contract. His salary is made up of a fixed portion (75%) and the remainder is a bonus based on the number of engine parts produced. $36,000 Standard maintenance on all the machines is performed once a month. Machine maintenance $52,000 Machine part replacements The cutting tools in each of the machines need to be replaced after a set number of machine hours. Tools $20,000 The total incurred varies in proportion with the number of engine parts produced. Utilities $96,000 This cost primarily relates to the number of machine hours (85%), but also includes the cost of lighting in the factory (15%). TAM This is the annual rental cost. Fred Factory rent $260,000 Engineering consultant $175.000 An engineer is employed on contract and is paid a fixed rate (60%) for each design he produces. He also receives a bonus (40%) based on the number of engine parts produced. $728,000 Total Cost year ended 30 June 2018 maddition, the management accountant has also collected monthly data for the overhead COSIS year ended 30 June 2018. He has also compiled information on machine hours, direct labour hours ans the volume of engine parts made in that year, which he thinks could be possible cost anvas Month Engine Parts Machine Volume Hours Direct Hours 10,750 35,000 61,000 31,000 36,000 26,000 54,000 42,000 38,000 40,000 49,000 35,000 21,000 468,000 7,500 10,000 11,000 9,000 11,000 9.500 11,500 11,500 10,000 10,900 10,600 8,750 121,250 16,000 14,000 16.800 13.800 16,700 17,000 15.000 16.000 15,500 13,000 178,250 Total Overhead Costs $45,000 $58,000 $64,000 $53,000 $66,000 $55,000 $70,000 $71,000 $62,000 $69,000 $63,000 $52,000 $728,000 12 Total For the year ended 30 June 2019, the actual overheads incurred by the company were $811,000 with actual machine hours of 132,000, direct labour hours of 190,000 and the total volume of engine parts made were 530,000. Required: We strongly recommend using Excel to prepare your answers to (a) and (b). In particular, for part (b) you will need to use the Data Analysis toolpak in Excel. (a) Classify the overhead costs detailed in the overhead cost breakdown on page 6 into fixed and variable costs. Explain your reasoning for the classification of each item. Using this classification, determine the annual cost function to be used in the year ended 30 June 2019 using the account method. (b) Determine the annual cost function using the monthly data above and using regression analysis. Select the cost driver(s) you think are best to estimate total overhead costs using this method. (To determine the best cost drivers you should consider the information provided in the overhead cost breakdown, prepare scatterplots for each cost driver and analyse the results of at least two alternative regression equations.). Question 2: Modelling Cost Behaviour Parts Company (TPC) is an engineering firm that produces custom-designed engine parts for customers who manufacture trucks. The company employs an engineering consultant who works with the company's customers to design the engineering specifications for the parts required. The company inen manufactures those parts in their factory to the customers' specifications. Each customers or varies in terms of the complexity of the engine part design and the volume of units they require The company has calculated its budgeted overhead costs using the account method for many years. This method is applied using machine hours. However, the management accountant has been analysing past budget variances and thinks this method has not been very good at predicting actual overhead costs. He has shared his concerns with the CFO, and she has asked him to prepare a comparison of the account method with the regression method (which the management accountant thinks should be adopted), and to present his findings in a memo. For the last income year (year ended 30 June 2019, the company's budgeted overhead costs were determined using the actual costs from the previous year (year ended 30 June 2018). In the year ended 30 June 2018, the total machine hours were 121,250 and the overhead cost breakdown of the costs incurred in the year ended 30 June 2018 is shown below: Overhead cost Total Cost Description (percentages relate to the total cost) Factory supervisor $89,000 The factory supervisor is employed on a flexible contract. His salary is made up of a fixed portion (75%) and the remainder is a bonus based on the number of engine parts produced. Machine maintenance $36,000 Standard maintenance on all the machines is performed once a month. Machine part replacements $52,000 The cutting tools in each of the machines need to be replaced after a set number of machine hours. Tools $20,000 Utilities S96.000 The total incurred varies in proportion with the number of engine parts produced This cost primarily relates to the number of machine hours (85%), but also includes the cost of lighting in the factory W MIA Factory rent $260,000 This is the annual rental cost ved Engineering consultant $175,000 An engineer is employed on contract and is paid a fixed rate (60%) for each design he produces. He also receives a bonus (40%) based on the number of engine parts produced. Total Cost year ended 30 June 2018 $728,000 In addition, the management accountant has also collected monthly data for the overhead costs for me year ended 30 June 2018. He has also compiled information on machine hours, direct labour hours and the volume of engine parts made in that year, which he thinks could be possible cost drivers. Month Engine Parts Machine Volume Hours 35,000 61,000 31,000 36,000 26,000 54,000 42,000 38,000 40,000 49,000 35,000 21,000 468,000 7,500 10,000 11,000 9,000 11,000 9,500 11,500 11,500 10,000 10,900 10,600 8.750 121,250 Direct Labour Hours 10,750 13,700 16,000 14,000 16,800 13,800 16,700 17,000 15,000 16,000 15,500 13.000 178,250 Total Overhead Costs $45,000 $58,000 $64,000 $53,000 $66,000 $55,000 $70,000 $71,000 $62,000 $69,000 $63,000 $52,000 $728,000 10 11 12 Total For the year ended 30 June 2019, the actual overheads incurred by the company were $811,000 with actual machine hours of 132,000, direct labour hours of 190,000 and the total volume of engine parts made were 530,000. Required: We strongly recommend using Excel to prepare your answers to (a) and (b). In particular, for part (b) you will need to use the Data Analysis toolpak in Excel. (a) Classify the overhead costs detailed in the overhead cost breakdown on page 6 into fixed and variable costs. Explain your reasoning for the classification of each item. Using this classification, determine the annual cost function to be used in the year ended 30 June 2019 using the account method. (b) Determine the annual cost function using the monthly data above and using regression analysis. Select the cost driver(s) you think are best to estimate total overhead costs using this method. (To determine the best cost drivers you should consider the information provided in the overhead cost breakdown, prepare scatterplots for each cost driver and analyse the results of at least two alternative regression equations.)
