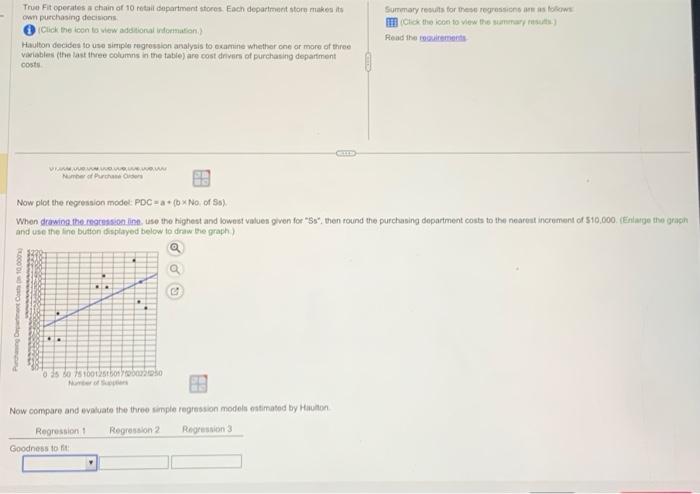
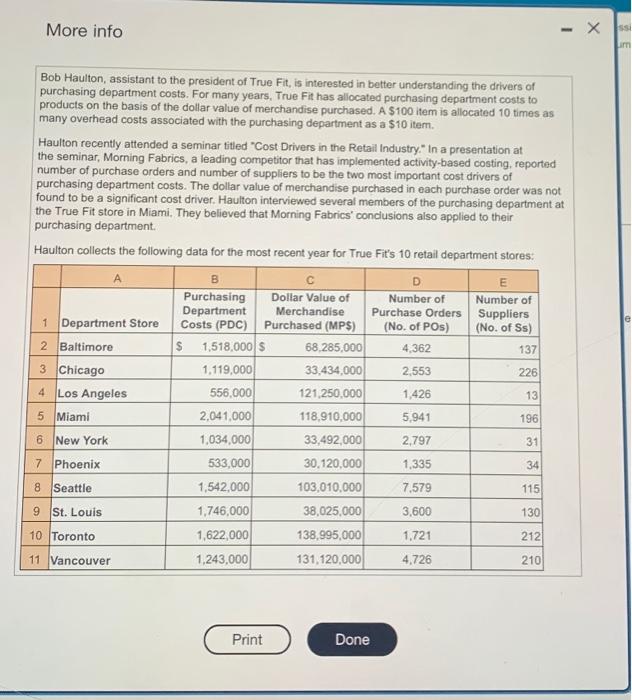
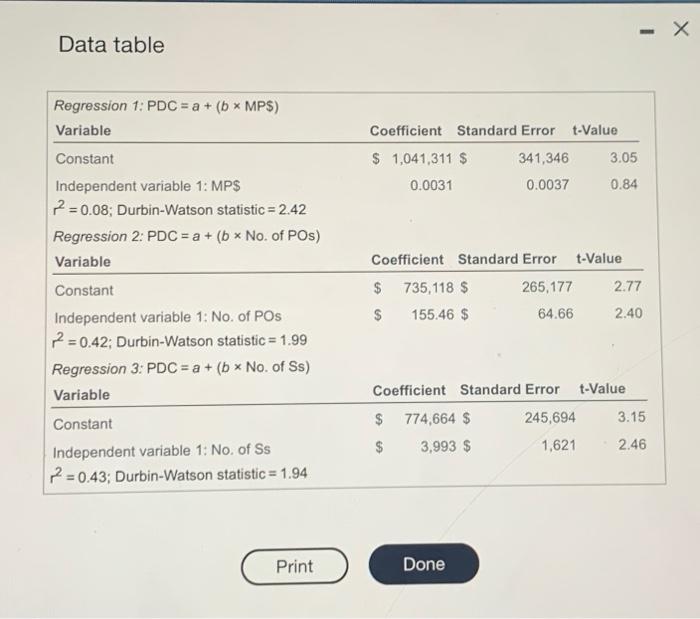
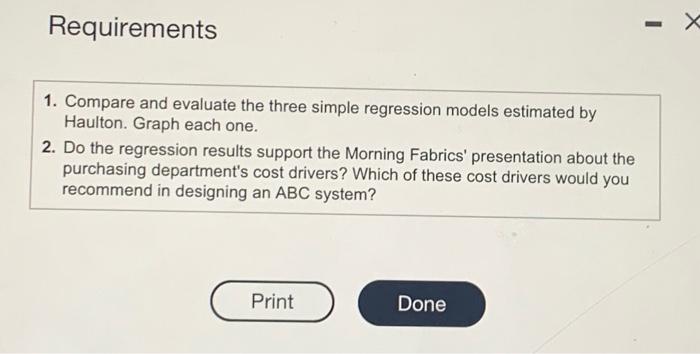
True Fit eperates a chain of 10 retail dopartment stores. Each departrnent store makes its owit purchining decisions Q iolick the icon fo view additional intormation.) Haulton decides to use simple regrossion analysis to ecamine whether cne or more of thiree vieiables (the last three columns in the table) are cost drivers of purchasing department costs Summary revils for these regrossicns ane as folcuws Read the Nember of tharchath Oison. Now plot the regression mode: PDC=a+(bNo; of Ss). and use the kne button displayed below to draw bie graph) Now compare and evaluate the three simple regression models estimated by Haunon. Bob Haulton, assistant to the president of True Fit, is interested in better understanding the drivers of purchasing department costs. For many years. True Fit has allocated purchasing department costs to products on the basis of the dollar value of merchandise purchased. A $100 item is allocated 10 times as many overhead costs associated with the purchasing department as a $10 item. Haulton recently attended a seminar titled "Cost Drivers in the Retail Industry." In a presentation at the seminar, Morning Fabrics, a leading competitor that has implemented activity-based costing, reported number of purchase orders and number of suppliers to be the two most important cost drivers of purchasing department costs. The dollar value of merchandise purchased in each purchase order was not found to be a significant cost driver. Haulton interviewed several members of the purchasing department at the True Fit store in Miami. They believed that Morning Fabrics' conclusions also applied to their purchasing department. Haulton collects the following data for the most recent year for True Fit's 10 retail department stores: Data table Requirements 1. Compare and evaluate the three simple regression models estimated by Haulton. Graph each one. 2. Do the regression results support the Morning Fabrics' presentation about the purchasing department's cost drivers? Which of these cost drivers would you recommend in designing an ABC system? True Fit eperates a chain of 10 retail dopartment stores. Each departrnent store makes its owit purchining decisions Q iolick the icon fo view additional intormation.) Haulton decides to use simple regrossion analysis to ecamine whether cne or more of thiree vieiables (the last three columns in the table) are cost drivers of purchasing department costs Summary revils for these regrossicns ane as folcuws Read the Nember of tharchath Oison. Now plot the regression mode: PDC=a+(bNo; of Ss). and use the kne button displayed below to draw bie graph) Now compare and evaluate the three simple regression models estimated by Haunon. Bob Haulton, assistant to the president of True Fit, is interested in better understanding the drivers of purchasing department costs. For many years. True Fit has allocated purchasing department costs to products on the basis of the dollar value of merchandise purchased. A $100 item is allocated 10 times as many overhead costs associated with the purchasing department as a $10 item. Haulton recently attended a seminar titled "Cost Drivers in the Retail Industry." In a presentation at the seminar, Morning Fabrics, a leading competitor that has implemented activity-based costing, reported number of purchase orders and number of suppliers to be the two most important cost drivers of purchasing department costs. The dollar value of merchandise purchased in each purchase order was not found to be a significant cost driver. Haulton interviewed several members of the purchasing department at the True Fit store in Miami. They believed that Morning Fabrics' conclusions also applied to their purchasing department. Haulton collects the following data for the most recent year for True Fit's 10 retail department stores: Data table Requirements 1. Compare and evaluate the three simple regression models estimated by Haulton. Graph each one. 2. Do the regression results support the Morning Fabrics' presentation about the purchasing department's cost drivers? Which of these cost drivers would you recommend in designing an ABC system