Answered step by step
Verified Expert Solution
Link Copied!

Question

1 Approved Answer

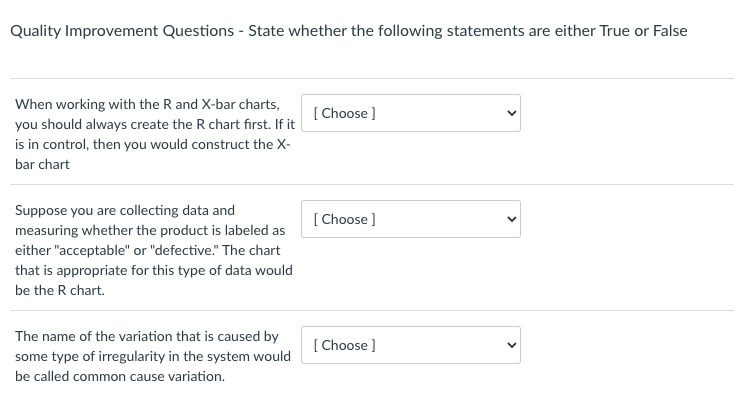
True or False Quality:r Improvement Questions - State whether the following statements are either True or False 1Inl'lvl'hen working with the R and Xbar charts,

True or False

image text in transcribed
Quality:r Improvement Questions - State whether the following statements are either True or False 1Inl'lvl'hen working with the R and Xbar charts, 1you should always create the R chart rst If it is in control, then 1you would construct the X- bar chart ' [Choose] V' Suppose you are collecting data and measuring whether the product is labeled as either "acceptable" or "defective." The chart that is appropriate for this type of data would be the R chart. ' [Choose] V' The name of the variation that is caused by some type of irregularity.r in the system would be called common cause variation. ' [Choose] V

Step by Step Solution

There are 3 Steps involved in it

Step: 1

blur-text-image

Get Instant Access to Expert-Tailored Solutions

See step-by-step solutions with expert insights and AI powered tools for academic success

Step: 2

blur-text-image

Step: 3

blur-text-image

Ace Your Homework with AI

Get the answers you need in no time with our AI-driven, step-by-step assistance

Get Started

Recommended Textbook for

Multiple Time Scale Dynamics

Authors: Christian Kuehn

1st Edition

3319123165, 9783319123165

More Books

Students also viewed these Mathematics questions

Question

OUTCOME 4 Explain how labour relations differ around the world.

Answered: 1 week ago