trying to find the best way to earn some cash for this year in my business strategy game. any tips?
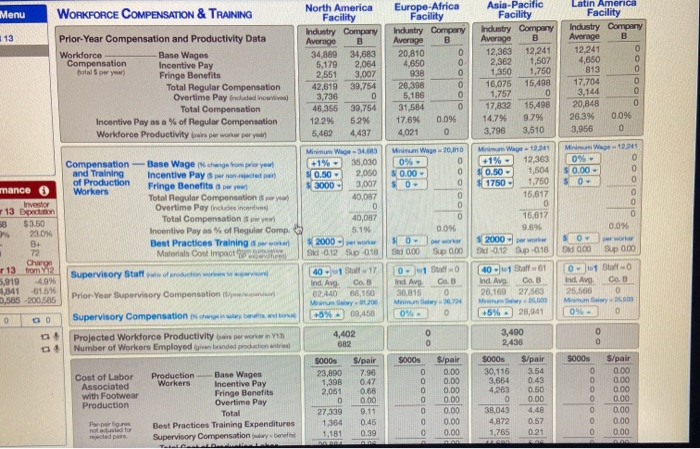
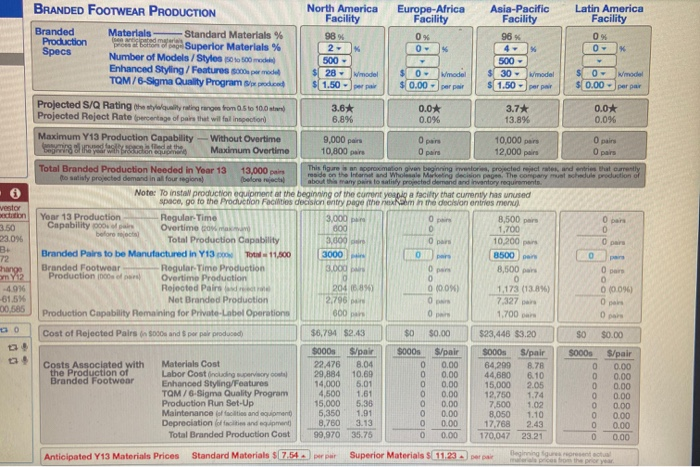
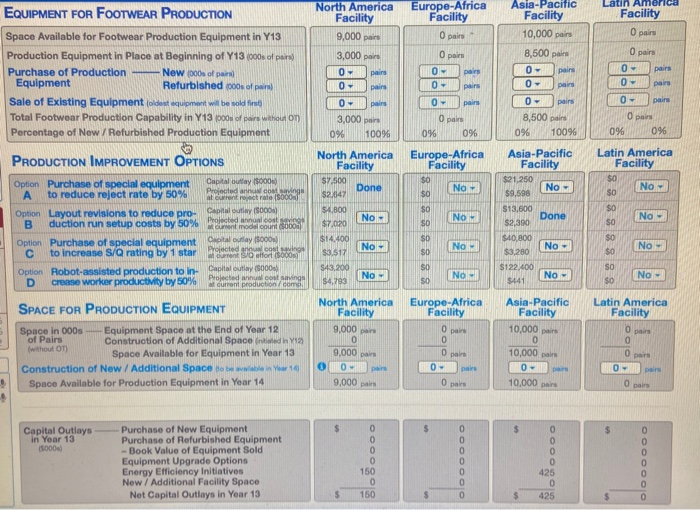
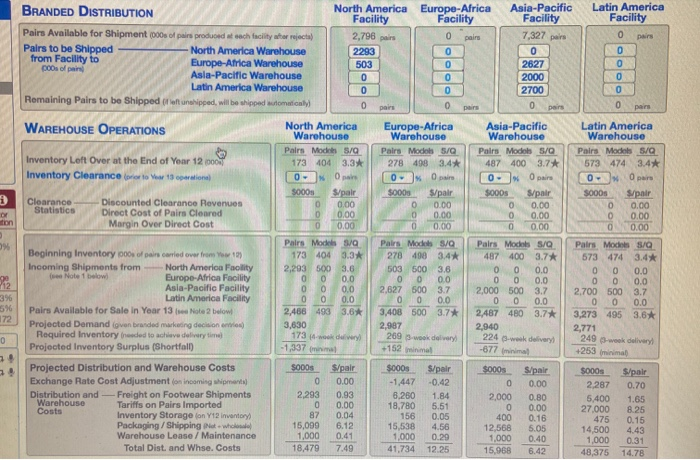
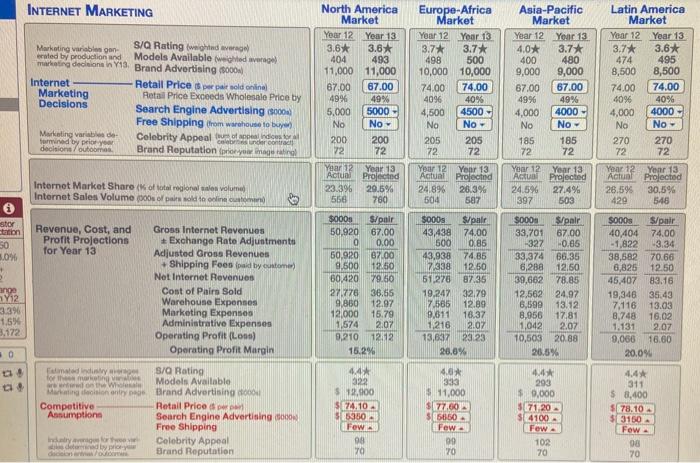
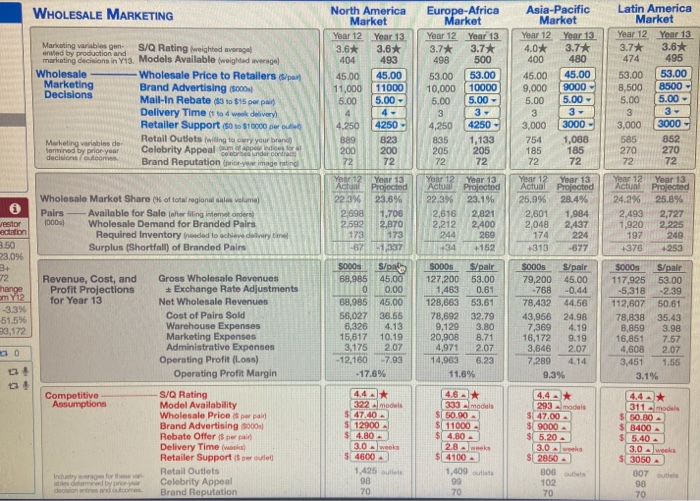
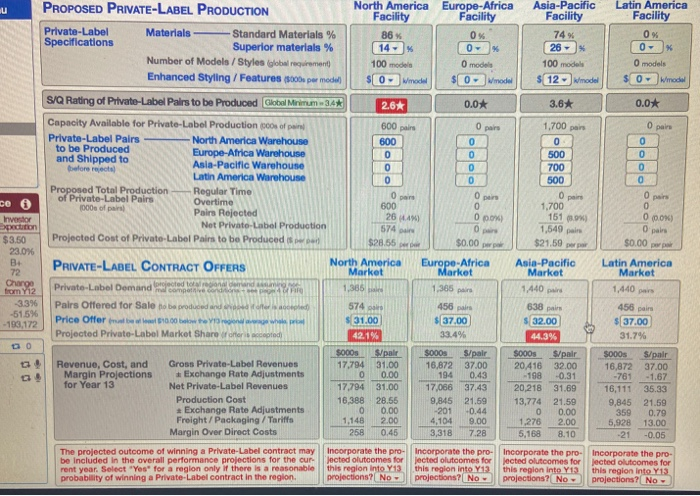
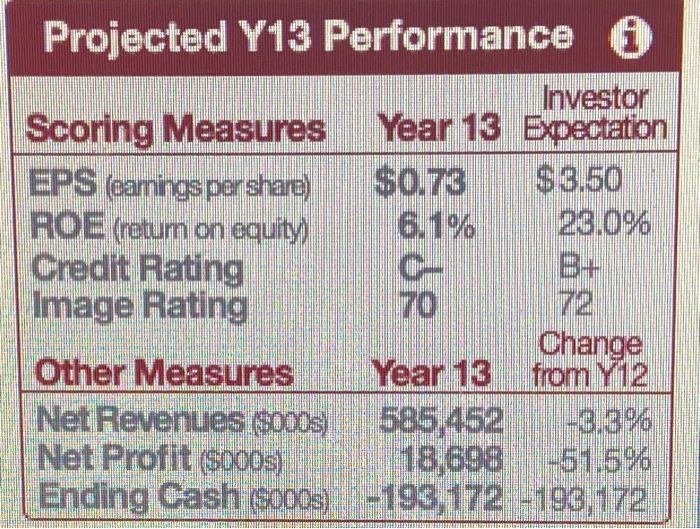
Menu 13 Europe Africa Facility Industry Company Average B 20,810 4,650 938 26,398 5,186 31,584 17.6% 0.09 4,021 0 OOOOOO Asia-Pacific Facility Industry Company Average 12,363 12,241 2,362 1,507 1,350 1,750 16,075 15,498 1,757 0 17,832 15,498 14.794 9.796 3,796 3,510 Latin America Facility Industry Company Average B 12,241 4,650 813 17,704 3,144 20,848 26.3% 0.096 3,956 0 olo olDoO OO 0- mance Investor 13 Expection 58 $3.50 23.0M B+ 72 Charge r13 from Y12 5,919 -4.9 2,841 -61.5% 0,585 -200,585 OOOOC WORKFORCE COMPENSATION & TRAINING North America Facility Prior-Year Compensation and Productivity Data Industry Company Average B Workforce Base Wages 34,889 34,683 Compensation hotel per year) Incentive Pay 5,179 2,064 Fringe Benefits 2,551 3,007 Total Regular Compensation 42,619 39,754 Overtime Pay included in vivo) 3,736 0 Total Compensation 46,355 39,754 Incentive Pay as a % of Regular Compensation 12.29% 5.29 Worldorce Productivity baper worlar peryod! 5.462 4,437 Minimum W34.683 Compensation - Base Wage change from prior your +1%- 35,030 and Training Incentive Pay period 10.50 2.050 of Production Workers Fringe Benefits owy 3000 3,007 Total Regular Compensation wyear 40,087 Overtime Pay include 0 Total Compensation towy 40,087 Incentive Pays % of Regular Comp. 5.196 Best Practices Training www 2000 Materials Cost Impact SK-0.12 Sp018 Supervisory Staff we of production 40 S12 Ind. Av Co Prior Year Supervisory Compensation 62.440 56,150 M100 Supervisory Compensation charged +5% 09.458 Projected Workforce Productivity per word in 13 4,402 Number of Workers Employed given branded production 602 $000 S/pair Cost of Labor Production Base Wages 23,890 7.96 Associated Workers Incentive Pay 1,398 with Footwear Fringe Benefits 2,061 0.68 Production Overtime Pay D 0.00 Total 27,339 Por per 1.364 Best Practices Training Expenditures 0.45 now for ced per Supervisory Compensation were 1,181 0.39 BO Minimum Wage 20,610 0% 0.00 - 0 0 0 0 0.0% 50 Std 0.00 Sup 0.00 Minimum Wage - 12.241 Min Wage - 1994 +1% 12,363 09- 0.50 - 1,504 0.00 1750 1,750 0 15,617 0 15,617 9.5% 0.08 2000 work Sd 0.12 3p-010 Sup 0.00 40 Saff 61 Ostalo Ind. Ave CB Ind. Ave COB 20.160 27,563 25.500 0 Memy. +5%.] 28,941 0% 0 0 -- Stato Ind Ave Ca. 36.815 0 Minnum 1674 0% 0 0 DO 0 0 0 0 S000 S000s S/pair 0.00 0.00 0.00 0 0 0 0 0 9 0 S/pair 0.00 0.00 0.00 0.00 0.00 0.00 0.00 3,490 2,438 $000s S/pair 30.116 3.54 3,664 0.43 4.263 0.50 0 0.00 38,043 4.872 0.57 1.765 0.21 OOOOOOO 0.00 0.00 0.00 0.00 96 9,000 paire 10,800 paire Open O pairs O par O pairs O 8,500 BRANDED FOOTWEAR PRODUCTION North America Europe-Africa Asia-Pacific Latin America Facility Facility Facility Facility Branded Materials Standard Materials % 98% 0% O Production mate proelio Superior Materials % 2- 0 % 4- % 0 x Specs Number of Models / Styles 500 500 500- 500 - Enhanced Styling / Features a permodell 28-model $0. model $ 30 model 0 model TOM / 6-Sigma Quality Program producent $1.50 per $ 0.00 per $1.50 per pair $ 0.00 per par Projected S/Q Rating the wywality rating raron trom 0.5 to 100 3.6* 0.0* 3.7* 0.0* Projected Reject Rate percentage of pars that will fail innection) 6.8% 0.0% 13.8% 0.0% Maximum Y13 Production Capability Without Overtime 10.000 pers fase is led at the Maximum Overtime 12,000 pairs Total Branded Production Needed in Year 13 13,000 This figure Approximation given beginning to projected rejectate and entries that currently reside to satisfy projected demand in all four regions) Internet and Wholesale Marketing decision pages. The company must duls production of before about the many par le sally projected demand and inventory requirements Note: To install production equipment at the beginning of the current you a facility that currenty has unused space, go to the Production Facilities decision entry page them in to decision entries menu Year 13 Production Regular Time 3.000 O par Capability of pain Overtime com 1.700 before Total Production Capability 3.000 10.200 Branded Pairs to be Manufactured in Y13 11,500 3000 0 0 Branded Footwear -RegularTime Production 31000 8.500 0 pers Production of Overtime Production 0 0 Rejected Pain 204 689 0 0.0% 1,173 (13.8%) 0 (0.096) Net Branded Production 2,796 O Open Production Capability Remaining for Private-Label Operation 1.700 Opal Cost of rejected Pairs in 8000 and $ per pair produced $6,794 $2.43 $0 $0.00 $23,448 $3.20 SO $0.00 5000s $/pair S000s S/pair $000 S/pair S000s S/pair Costs Associated with Materials Cost 22.476 8.04 0 0.00 64,200 8.78 0 0.00 the Production of Labor Cost including service 29,884 10.60 0 44,600 6.10 O 0.00 Branded Footwear Enhanced Styling Features 14,000 5.01 0 0.00 15,000 2.05 0 0.00 TOM / 6-Sigma Quality Program 1.61 0 0.00 12,750 1.74 O 0.00 Production Run Set-Up 15,000 5.36 0 0.00 7,500 1.02 0 0.00 Maintenance of and some 6,350 1.91 0 0.00 8,050 1.10 0 0.00 Depreciation of facilities and it 8,760 3.13 O 0.00 17.768 2.43 0 0.00 Total Branded Production Cost 99,970 35.75 0 0.00 170,047 23. 21 0 0.00 Anticipated Y13 Materials Prices Standard Materials $7.54 Superior Materials $11. 23 Depair Beginning questa 000 Op vestor action 3.50 23.0% B 72 Change my 2 -4.9 61.5% 00,585 Op 3500 7.327 000 O 30 0.00 4,500 Europe-Africa Facility O pairs Latin America Facility O pairs North America Facility 9,000 pairs 3,000 paire 0- pairs 0- pairs 0 Asia-Pacific Facility 10,000 paire 8,500 paire 0- 0- EQUIPMENT FOR FOOTWEAR PRODUCTION Space Available for Footwear Production Equipment in Y13 Production Equipment in Place at Beginning of Y13 000 of a Purchase of Production New pocs of pairs Equipment Refurbished 200s of pain Sale of Existing Equipment (oldest equipment will be sold in Total Footwear Production Capability in Y13000s of pare without on Percentage of New / Refurbished Production Equipment O pairs O pairs pairs pain pairs 0 0- 0 0- pairs pain pain 0- pairs pairs 3,000 pairs 0 pairs O paire 0% 0% 0 pairs 8,500 paire 0% 100% O pain 0% 100% 0% 096 North America Facility $7.500 Done $2.847 54.800 No $7,020 $14.400 No $3.517 543,200 No $4,793 Europe-Africa Facility $0 No SO SO NO SO Asia-Pacific Facility $21.250 No- $9,598 S13,600 Done $2,390 $40,800 No $3.280 $122.400 $441 No- Latin America Facility SO No 50 SO No SO SO No No SO SO SO PRODUCTION IMPROVEMENT OPTIONS Option Purchase of special equipment Capital outlay(5000) to reduce reject rate by 50% Projected and contings al current cate 15000 Option Layout revisions to reduce pro- Capital outlay(5000 B duction run setup costs by 50% Polected annualco Option Purchase of special equipment Collay(5000 to increase S/Q rating by 1 star Projected online Murrent Solfort (9000 Option Robot-assisted production to in Capital outlayS000 D crease worker productity by 50% deste proyectanga SPACE FOR PRODUCTION EQUIPMENT Space in 00s Equipment Space at the End of Year 12 of Pairs Construction of Additional Space in 12 (without OT Space Available for Equipment in Year 13 Construction of New / Additional Space to win Yow 14 Space Available for Production Equipment in Year 14 $0 SO NO No- SO SO Asia-Pacific Facility Latin America Facility North America Facility 9.000 par 0 9,000 pairs 0 Europe-Africa Facility 0 0 0 pairs O pain 10,000 O pain 0 olo o 10,000 O por pare 0- Ipan 0- pair - 9,000 pair 0 pairs 10.000 par O pairs $ $ Capital Outlays in Year 13 000 0 0 Purchase of New Equipment Purchase of Refurbished Equipment -Book Value of Equipment Sold Equipment Upgrade Options Energy Efficiency Initiatives New / Additional Facility Space Net Capital Outlays in Year 13 0 0 0 0 150 0 150 OOOO OOOOOO O 0 425 0 425 0 7,327 pairs i 0.00 tion BRANDED DISTRIBUTION North America Europe-Africa Asia-Pacific Latin America Facility Facility Facility Facility Pairs Available for Shipments of pairs produced at each facility after rejects) 2,796 pairs 0 0 pairs Pairs to be shipped North America Warehouse 2293 0 0 0 from Facility to Os of pain Europe-Africa Warehouse 503 0 2627 0 Asia-Pacific Warehouse 0 0 2000 0 Latin America Warehouse 0 0 2700 0 Remaining Pairs to be shipped loft unehipped, will be shipped automatically 0 pairs 0 pairs 0 pairs 0 pair WAREHOUSE OPERATIONS North America Europe-Africa Asia-Pacific Latin America Warehouse Warehouse Warehouse Warehouse Pairs Models S/ Pairs Models 5/0 Pairs Models S/Q Pairs Models S/Q Inventory Left Over at the End of Year 12 0001 173 404 3.3* 278 498 3.4* 487 400 3.7* 573 474 3.4* Inventory Clearance or to You 13 operatione 0 Open 0 0 paire 0- O pairs 0 - 0 pairs SOOos S/pair $0005 S/pair $000 spair SOOS spair Clearance Discounted Clearance Revenues 0.00 0.00 0 0.00 0 0.00 Statistics Direct Cost of Pairs Cleared 0 0.00 0 0.00 0 0.00 O Margin Over Direct Cost 0 0.00 0 0.00 0 0.00 O 0.00 Pairs Models S/a Pairs Models So Pairs Models S/Q Pairs Models S/ Beginning Inventory 000s of pains carried over from you 173 404 3.3* 278 498 3.4* 487 400 3.7* 573 474 3.4 Incoming Shipments from North America Facility 2,293 500 3.6 503 500 3,6 0 0 0 0 0.0 Note 1 below Europe-Africa Facility 0 0.0 0 0 0.0 0 0 0.0 0 0 0.0 Asia-Pacific Facility 0 0 0.0 2.627 500 3.7 2,000 500 3.7 2,700 500 3.7 Latin America Facility 0 0 0.0 0 0 0.0 0 0 0.0 0 0 0.0 Pairs Available for Sale in Year 13 Note 2 below 2,466 493 3.6* 3,408 500 3.7* 2,487 480 3.7* 3,273 495 3.6* Projected Demand van branded marketing decisione 3,630 2,987 2,940 2,771 Required Inventory needed to achieve delivery time 269 3-wook delivery 224 3 we delivery 249 - we delivery Projected Inventory Surplus (Shortfall) -1,337 -152 minimal Projected Distribution and Warehouse Costs S000s S/pair $000s S/pair S000 S/pair 5000s S/pair Exchange Rate Cost Adjustment (on incoming home 0 0.00 -1,447 -0.42 0 0.00 2,287 0.70 Distribution and Freight on Footwear Shipments 2,293 0.93 8,260 1.84 2,000 0.80 6,400 1.65 Warehouse Tariffs on Pairs Imported 0 0.00 18,780 5.51 0 0.00 Costs 27.000 8.25 Inventory Storage on Y12 inventory 87 0.04 156 0.05 400 0.16 475 0.15 Packaging / Shipping Net - which 15,099 6.12 15,538 4.56 12,568 5.05 14,500 4.43 Warehouse Lease / Maintenance 1,000 0.41 1,000 0.29 1,000 0.40 1,000 0.31 Total Dist, and Whse. Costs 18,479 7.49 41.734 12.25 15,968 6.42 48,375 14.78 0.0 g Vi2 396 596 172 0 -677 253 . INTERNET MARKETING 498 Marketing variables gen- S/Q Rating weighted average erated by production and Models Available weighted average marketing decision in Y19. Brand Advertising 5000 Internet Retail Price per pairsold online Marketing Retail Price Exceeds Wholesale Price by Decisions Search Engine Advertising (5000) Free Shipping from warehouse to buy Marketing variables de Celebrity Appeal no com indien termined by prior year decisions outcomes Brand Reputation (priorysu image ratirol North America Market Year 12 Year 13 3.6* 3.6* 404 493 11,000 11,000 67.00 67.00 4996 49% 5,000 5000 No No 200 200 72 72 Year 12 Year 13 Actual Projected 23.3% 29.5% 556 760 Europe-Africa Market Year 12 Year 13 3.7* 3.7* 500 10,000 10,000 74.00 74.00 4096 40% 4,500 4500 No No - 205 205 72 72 Asia-Pacific Market Year 12 Year 13 4.0* 3.7* 400 480 9,000 9,000 67.00 67.00 49% 49% 4,000 4000- No No - 185 185 72 72 Latin America Market Year 12 Year 13 3.7* 3.6* 474 495 8,500 8,500 74.00 74.00 4096 40% 4,000 4000 No No 270 270 72 72 Internet Market Share (% of total regional sales volume) Internet Sales Volume (cos of pairs sold to online customer Year 12 Year 13 Actual Projected 24.8% 26.3% 504 Year 12 Year 13 Actual Projected 24.5% 27.4% 503 Year 12 Actual 26.596 429 Year 13 Projected 30.5% 546 587 397 stor 50 1.096 + ange $000s $/pair 50,920 67.00 0 0.00 50,920 67.00 9.500 12.50 60,420 79.50 27.776 36.65 9,860 12.97 12,000 15.79 1.574 2.07 9,210 12.12 15.2% $000s Spalr 43,438 74.00 500 0.85 43,938 74.85 7/338 12.50 51.276 87.35 19,247 32.79 7.565 12.89 9,811 16.37 1,216 2.07 13,637 23.23 20.6% Revenue, Cost, and Gross Internet Revenues Profit Projections Exchange Rate Adjustments for Year 13 Adjusted Gross Revenues + Shipping Fees paid by customer) Net Internet Revenues Cost of Pairs Sold Warehouse Expenses Marketing Expenses Administrative Expenses Operating Profit (Lon.) Operating Profit Margin Estimated industry averages S/Q Rating for the marketing are entered on the whole Models Available Marketing decision entry Brand Advertising 000 Competitive Retail Price Assumptions Search Engine Advertising 000 Free Shipping Industry average for the Celebrity Appeal be determined by priory Brand Reputation SO0Os $/pair 33,701 67.00 -327 -0.65 33,374 66.35 6,288 12.50 39,662 78.85 12,562 24.97 6,599 13.12 8,956 17.81 1,042 2.07 10,503 20.88 26.5% $000s S/pair 40,404 74.00 -1,822 -3.34 38,582 70.66 6,825 12.50 45,407 83.16 19,346 35.43 7,116 13.03 8,748 16.02 1.131 2.07 9,066 16.60 20.0% Y12 3.3% 1.5% 3.172 50 4.41 322 $ 12,900 $174.10 S350 Few 98 70 4.6* 333 $ 11,000 $177,60 $15050 Few 99 70 4.4% 293 $ 9,000 $ 171.20 SC 4100 Few 102 70 4.4* 311 $ 8,400 $78.10 $3150. Fow 98 70 WHOLESALE MARKETING Marketing variables gen S/Q Rating weighted average marketing decisions in Y18. Models Available weighted average Wholesale Wholesale Price to Retailers span Marketing Brand Advertising (5000 Decisions Mail-in Rebate 9 to $15 por part Delivery Time (1 to 4 wek delivery Retailer Support (50 to $10000 Retail Outlets witing to cry your brand Marketing variables de termined by prior year Celebrity Appeal am creeper decisions/Outcomes Brand Reputation priory image rating North America Market Year 12 Year 13 3.6* 3.6* 404 493 45.00 45.00 11,000 11000 5.00 5.00 - Europe-Africa Market Year 12 Year 13 3.7* 3.7* 498 500 53.00 53.00 10,000 10000 5.00 5.00 3 4,250 4250 835 1,133 205 205 72 72 Asia-Pacific Market Year 12 Year 13 4.0* 3.7* 400 480 45.00 45.00 9,000 9000 - 5.00 5.00 3 3- 3,000 3000 754 1,088 185 185 72 72 Latin America Market Year 12 Year 13 3.7* 3.6* 474 495 53.00 53.00 8,500 8500 - 5.00 5.00 - 3 3- 3,000 3000 585 852 270 270 72 72 3- 4.250 889 200 72 4250 823 200 72 Wholesale Market Share (% of total regional sales volume) Pairs Available for Sale (aer Sling inom orders 1000) Wholesale Demand for Branded Pairs Required Inventory needed to achievedelery time Surplus (Shortfall) of Branded Pairs Year 12 Year 13 Achal Projected 22.3% 23.6% 2,698 1,706 2.592 2,870 173 173 -67 -1,337 Year 12 Year 13 Actual Projected 22.3% 23.1% 2,616 2,821 2,212 2,400 244 269 34 152 Year 12 Year 13 Actual Projected 25.9% 28.4% 2,601 1,984 2,048 2,437 174 224 -313 -677 Year 12 Actual 24.2% 2,493 1,920 197 +370 Year 13 Projected 25.8% 2,727 2.225 249 +253 vestor ectation 3.50 23.096 3+ 72 hange em Y12 -3.394 51.5% 33,172 Revenue, Cost, and Profit Projections for Year 13 0.61 Gross Wholesale Revenues Exchange Rate Adjustments Net Wholesale Revenues Cost of Pairs Sold Warehouse Expenses Marketing Expenses Administrative Expenses Operating Profit (Loss) Operating Profit Margin $000s S/page 68,985 45.00 0 0.00 68,985 45.00 56,027 36.55 8,326 4.13 15,617 10.19 3,175 2.07 -12,160 -7.93 - 17.6% S000 S/pair 127,200 53.00 1,463 128,663 53.61 78,692 32.79 9,129 3.80 20,908 8.71 4,971 2.07 14,963 6.23 11.6% 5000s S/pair 79,200 45.00 -768 -0.44 78,432 44.56 43,956 24.98 7,369 4.19 16,172 9.19 3,646 2.07 7,289 4.14 9.3% $000s S/pair 117,925 53.00 -5,318 -2.39 112,607 50.61 78,838 35.43 8,859 3.98 16,851 7.57 4,608 2.07 3,451 1.56 3.1% GO Competitive Assumptions S/Q Rating Model Availability Wholesale Prices por pall Brand Advertising 5000 Rebate Offer is perpill Delivery Time (la Retailer Supporteret Retail Outlets Celebrity Appeal Brand Reputation 442 322 model $47.40 S 12900 $ 4.80 3.0 weeks $4600 1.425 98 70 4.6 333 al models $50.00 SL 11000 $[ 4.80 28. $ 4100 1,409 99 70 4.4.* 293 models $47.00 $ 9000 S[ 5.20 3.0 ks S[ 2850 300 102 70 4.4 * 311 models $50.80 $ 8400 $5.40 3.0 wooks $ 3050 307 98 70 abied by pro decisions and outcom 000 pair O pair 1,700 pair O pain 00.00 PROPOSED PRIVATE-LABEL PRODUCTION North America u Europe-Africa Asia-Pacific Latin America Facility Facility Facility Facility Private Label Materials Standard Materials % 86 0% 74% 0% Specifications Superior materials % 14- 0 % 26 - ) 0 Number of Models / Styles global requirement) 100 modelo O models 100 models O models Enhanced Styling / Features 8000 per modul SO model $0 model 12 model SO-model S/Q Rating of Private-Label Palrs to be produced Global Minimum 3.4* 2.6* 0.0* 3.6* 0.0* Capacity Available for Private-Label Production 600w of pain Private Label Pairs North America Warehouse 600 0 0 0 to be Produced Europe-Africa Warehouse 0 0 500 0 and Shipped to Asia-Pacific Warehouse before rejects 0 0 700 0 Latin America Warehouse 0 0 500 0 Proposed Total Production Regular Time O paire O pairs of Private Label Pairs pairs ce O pairs Overtime 1000s of pars 600 0 1,700 0 Paira Rejected Investor practition Net Private Label Production O pairs $3.50 Projected Cost of Private Label Pairs to be produced 23.0% B North America Europe-Africa Asia-Pacific Latin America PRIVATE-LABEL CONTRACT OFFERS 72 Market Market Market Market Charge from Y12 Private Label Demand 1,386 -3.396 Pairs Offered for Sale to be produced and -51.5% Price Offermato 10.00 S 31.00 $ 37,00 $ 32.00 -193,172 $37.00 Projected Private-Label Market Share oftoris accepted 42.1% 33.4% 44.3% 31.7% DO $000s Spalis 5000s S/pair S000 S/pair Soos S/pair Revenue, Cost, and Gross Private Label Revenues 17,794 31.00 16,872 37.00 20416 32.00 16,872 37.00 Margin Projections Exchange Rate Adjustments 0 0.00 194 0.43 -198 -0.31 -761 -1.67 for Year 13 Net Private-Label Revenues 17,794 31.00 17,066 37.43 20,218 31.69 16,111 35.33 Production Cost 16,388 28.55 9,845 21.59 13,774 21.59 9,845 21.59 + Exchange Rate Adjustments 0 0.00 -201 -0.44 0.00 359 0.79 Freight / Packaging/Tariffs 1,148 2.00 4,104 9.00 1,276 2.00 5,928 13.00 Margin Over Direct Costs 258 0.45 3,318 7.28 5,168 8.10 -21 -0.05 The projected outcome of winning a Private Label contract may Incorporate the pro Incorporate the pro- Incorporate the pro- Incorporate the pro- be included in the overall performance projections for the cur Jected outcomes for jected outcomes for lected outcomes for Jected outcomes for rent year. Select "Yes" for a region only if there is a reasonable this region into Y13 this region into 13 this region into Y13 this region into Y13 probability of winning a Private Label contract in the region. projections? No projections? No projections? No projections? No 26 AM 574 $28.55 0 O $0.00 1519 1,549 $21.59 $0.00 1,440 1.365 par 456 1.440 638 574 456 paire Projected Y13 Performance 6 Investor Scoring Measures Year 13 Expectation EPS (camingspershare) $0.73 $3.50 ROE (rotum on equity) 6.1% 28.096 Credit Rating C- Image Rating 70 Change Other Measures Year 13 from Y12 Net Revenues $0005) 586,452 Net Profit (5000s) 18,698 -51,5% Ending Cash (5000s),-199,172 -193,172 de Menu 13 Europe Africa Facility Industry Company Average B 20,810 4,650 938 26,398 5,186 31,584 17.6% 0.09 4,021 0 OOOOOO Asia-Pacific Facility Industry Company Average 12,363 12,241 2,362 1,507 1,350 1,750 16,075 15,498 1,757 0 17,832 15,498 14.794 9.796 3,796 3,510 Latin America Facility Industry Company Average B 12,241 4,650 813 17,704 3,144 20,848 26.3% 0.096 3,956 0 olo olDoO OO 0- mance Investor 13 Expection 58 $3.50 23.0M B+ 72 Charge r13 from Y12 5,919 -4.9 2,841 -61.5% 0,585 -200,585 OOOOC WORKFORCE COMPENSATION & TRAINING North America Facility Prior-Year Compensation and Productivity Data Industry Company Average B Workforce Base Wages 34,889 34,683 Compensation hotel per year) Incentive Pay 5,179 2,064 Fringe Benefits 2,551 3,007 Total Regular Compensation 42,619 39,754 Overtime Pay included in vivo) 3,736 0 Total Compensation 46,355 39,754 Incentive Pay as a % of Regular Compensation 12.29% 5.29 Worldorce Productivity baper worlar peryod! 5.462 4,437 Minimum W34.683 Compensation - Base Wage change from prior your +1%- 35,030 and Training Incentive Pay period 10.50 2.050 of Production Workers Fringe Benefits owy 3000 3,007 Total Regular Compensation wyear 40,087 Overtime Pay include 0 Total Compensation towy 40,087 Incentive Pays % of Regular Comp. 5.196 Best Practices Training www 2000 Materials Cost Impact SK-0.12 Sp018 Supervisory Staff we of production 40 S12 Ind. Av Co Prior Year Supervisory Compensation 62.440 56,150 M100 Supervisory Compensation charged +5% 09.458 Projected Workforce Productivity per word in 13 4,402 Number of Workers Employed given branded production 602 $000 S/pair Cost of Labor Production Base Wages 23,890 7.96 Associated Workers Incentive Pay 1,398 with Footwear Fringe Benefits 2,061 0.68 Production Overtime Pay D 0.00 Total 27,339 Por per 1.364 Best Practices Training Expenditures 0.45 now for ced per Supervisory Compensation were 1,181 0.39 BO Minimum Wage 20,610 0% 0.00 - 0 0 0 0 0.0% 50 Std 0.00 Sup 0.00 Minimum Wage - 12.241 Min Wage - 1994 +1% 12,363 09- 0.50 - 1,504 0.00 1750 1,750 0 15,617 0 15,617 9.5% 0.08 2000 work Sd 0.12 3p-010 Sup 0.00 40 Saff 61 Ostalo Ind. Ave CB Ind. Ave COB 20.160 27,563 25.500 0 Memy. +5%.] 28,941 0% 0 0 -- Stato Ind Ave Ca. 36.815 0 Minnum 1674 0% 0 0 DO 0 0 0 0 S000 S000s S/pair 0.00 0.00 0.00 0 0 0 0 0 9 0 S/pair 0.00 0.00 0.00 0.00 0.00 0.00 0.00 3,490 2,438 $000s S/pair 30.116 3.54 3,664 0.43 4.263 0.50 0 0.00 38,043 4.872 0.57 1.765 0.21 OOOOOOO 0.00 0.00 0.00 0.00 96 9,000 paire 10,800 paire Open O pairs O par O pairs O 8,500 BRANDED FOOTWEAR PRODUCTION North America Europe-Africa Asia-Pacific Latin America Facility Facility Facility Facility Branded Materials Standard Materials % 98% 0% O Production mate proelio Superior Materials % 2- 0 % 4- % 0 x Specs Number of Models / Styles 500 500 500- 500 - Enhanced Styling / Features a permodell 28-model $0. model $ 30 model 0 model TOM / 6-Sigma Quality Program producent $1.50 per $ 0.00 per $1.50 per pair $ 0.00 per par Projected S/Q Rating the wywality rating raron trom 0.5 to 100 3.6* 0.0* 3.7* 0.0* Projected Reject Rate percentage of pars that will fail innection) 6.8% 0.0% 13.8% 0.0% Maximum Y13 Production Capability Without Overtime 10.000 pers fase is led at the Maximum Overtime 12,000 pairs Total Branded Production Needed in Year 13 13,000 This figure Approximation given beginning to projected rejectate and entries that currently reside to satisfy projected demand in all four regions) Internet and Wholesale Marketing decision pages. The company must duls production of before about the many par le sally projected demand and inventory requirements Note: To install production equipment at the beginning of the current you a facility that currenty has unused space, go to the Production Facilities decision entry page them in to decision entries menu Year 13 Production Regular Time 3.000 O par Capability of pain Overtime com 1.700 before Total Production Capability 3.000 10.200 Branded Pairs to be Manufactured in Y13 11,500 3000 0 0 Branded Footwear -RegularTime Production 31000 8.500 0 pers Production of Overtime Production 0 0 Rejected Pain 204 689 0 0.0% 1,173 (13.8%) 0 (0.096) Net Branded Production 2,796 O Open Production Capability Remaining for Private-Label Operation 1.700 Opal Cost of rejected Pairs in 8000 and $ per pair produced $6,794 $2.43 $0 $0.00 $23,448 $3.20 SO $0.00 5000s $/pair S000s S/pair $000 S/pair S000s S/pair Costs Associated with Materials Cost 22.476 8.04 0 0.00 64,200 8.78 0 0.00 the Production of Labor Cost including service 29,884 10.60 0 44,600 6.10 O 0.00 Branded Footwear Enhanced Styling Features 14,000 5.01 0 0.00 15,000 2.05 0 0.00 TOM / 6-Sigma Quality Program 1.61 0 0.00 12,750 1.74 O 0.00 Production Run Set-Up 15,000 5.36 0 0.00 7,500 1.02 0 0.00 Maintenance of and some 6,350 1.91 0 0.00 8,050 1.10 0 0.00 Depreciation of facilities and it 8,760 3.13 O 0.00 17.768 2.43 0 0.00 Total Branded Production Cost 99,970 35.75 0 0.00 170,047 23. 21 0 0.00 Anticipated Y13 Materials Prices Standard Materials $7.54 Superior Materials $11. 23 Depair Beginning questa 000 Op vestor action 3.50 23.0% B 72 Change my 2 -4.9 61.5% 00,585 Op 3500 7.327 000 O 30 0.00 4,500 Europe-Africa Facility O pairs Latin America Facility O pairs North America Facility 9,000 pairs 3,000 paire 0- pairs 0- pairs 0 Asia-Pacific Facility 10,000 paire 8,500 paire 0- 0- EQUIPMENT FOR FOOTWEAR PRODUCTION Space Available for Footwear Production Equipment in Y13 Production Equipment in Place at Beginning of Y13 000 of a Purchase of Production New pocs of pairs Equipment Refurbished 200s of pain Sale of Existing Equipment (oldest equipment will be sold in Total Footwear Production Capability in Y13000s of pare without on Percentage of New / Refurbished Production Equipment O pairs O pairs pairs pain pairs 0 0- 0 0- pairs pain pain 0- pairs pairs 3,000 pairs 0 pairs O paire 0% 0% 0 pairs 8,500 paire 0% 100% O pain 0% 100% 0% 096 North America Facility $7.500 Done $2.847 54.800 No $7,020 $14.400 No $3.517 543,200 No $4,793 Europe-Africa Facility $0 No SO SO NO SO Asia-Pacific Facility $21.250 No- $9,598 S13,600 Done $2,390 $40,800 No $3.280 $122.400 $441 No- Latin America Facility SO No 50 SO No SO SO No No SO SO SO PRODUCTION IMPROVEMENT OPTIONS Option Purchase of special equipment Capital outlay(5000) to reduce reject rate by 50% Projected and contings al current cate 15000 Option Layout revisions to reduce pro- Capital outlay(5000 B duction run setup costs by 50% Polected annualco Option Purchase of special equipment Collay(5000 to increase S/Q rating by 1 star Projected online Murrent Solfort (9000 Option Robot-assisted production to in Capital outlayS000 D crease worker productity by 50% deste proyectanga SPACE FOR PRODUCTION EQUIPMENT Space in 00s Equipment Space at the End of Year 12 of Pairs Construction of Additional Space in 12 (without OT Space Available for Equipment in Year 13 Construction of New / Additional Space to win Yow 14 Space Available for Production Equipment in Year 14 $0 SO NO No- SO SO Asia-Pacific Facility Latin America Facility North America Facility 9.000 par 0 9,000 pairs 0 Europe-Africa Facility 0 0 0 pairs O pain 10,000 O pain 0 olo o 10,000 O por pare 0- Ipan 0- pair - 9,000 pair 0 pairs 10.000 par O pairs $ $ Capital Outlays in Year 13 000 0 0 Purchase of New Equipment Purchase of Refurbished Equipment -Book Value of Equipment Sold Equipment Upgrade Options Energy Efficiency Initiatives New / Additional Facility Space Net Capital Outlays in Year 13 0 0 0 0 150 0 150 OOOO OOOOOO O 0 425 0 425 0 7,327 pairs i 0.00 tion BRANDED DISTRIBUTION North America Europe-Africa Asia-Pacific Latin America Facility Facility Facility Facility Pairs Available for Shipments of pairs produced at each facility after rejects) 2,796 pairs 0 0 pairs Pairs to be shipped North America Warehouse 2293 0 0 0 from Facility to Os of pain Europe-Africa Warehouse 503 0 2627 0 Asia-Pacific Warehouse 0 0 2000 0 Latin America Warehouse 0 0 2700 0 Remaining Pairs to be shipped loft unehipped, will be shipped automatically 0 pairs 0 pairs 0 pairs 0 pair WAREHOUSE OPERATIONS North America Europe-Africa Asia-Pacific Latin America Warehouse Warehouse Warehouse Warehouse Pairs Models S/ Pairs Models 5/0 Pairs Models S/Q Pairs Models S/Q Inventory Left Over at the End of Year 12 0001 173 404 3.3* 278 498 3.4* 487 400 3.7* 573 474 3.4* Inventory Clearance or to You 13 operatione 0 Open 0 0 paire 0- O pairs 0 - 0 pairs SOOos S/pair $0005 S/pair $000 spair SOOS spair Clearance Discounted Clearance Revenues 0.00 0.00 0 0.00 0 0.00 Statistics Direct Cost of Pairs Cleared 0 0.00 0 0.00 0 0.00 O Margin Over Direct Cost 0 0.00 0 0.00 0 0.00 O 0.00 Pairs Models S/a Pairs Models So Pairs Models S/Q Pairs Models S/ Beginning Inventory 000s of pains carried over from you 173 404 3.3* 278 498 3.4* 487 400 3.7* 573 474 3.4 Incoming Shipments from North America Facility 2,293 500 3.6 503 500 3,6 0 0 0 0 0.0 Note 1 below Europe-Africa Facility 0 0.0 0 0 0.0 0 0 0.0 0 0 0.0 Asia-Pacific Facility 0 0 0.0 2.627 500 3.7 2,000 500 3.7 2,700 500 3.7 Latin America Facility 0 0 0.0 0 0 0.0 0 0 0.0 0 0 0.0 Pairs Available for Sale in Year 13 Note 2 below 2,466 493 3.6* 3,408 500 3.7* 2,487 480 3.7* 3,273 495 3.6* Projected Demand van branded marketing decisione 3,630 2,987 2,940 2,771 Required Inventory needed to achieve delivery time 269 3-wook delivery 224 3 we delivery 249 - we delivery Projected Inventory Surplus (Shortfall) -1,337 -152 minimal Projected Distribution and Warehouse Costs S000s S/pair $000s S/pair S000 S/pair 5000s S/pair Exchange Rate Cost Adjustment (on incoming home 0 0.00 -1,447 -0.42 0 0.00 2,287 0.70 Distribution and Freight on Footwear Shipments 2,293 0.93 8,260 1.84 2,000 0.80 6,400 1.65 Warehouse Tariffs on Pairs Imported 0 0.00 18,780 5.51 0 0.00 Costs 27.000 8.25 Inventory Storage on Y12 inventory 87 0.04 156 0.05 400 0.16 475 0.15 Packaging / Shipping Net - which 15,099 6.12 15,538 4.56 12,568 5.05 14,500 4.43 Warehouse Lease / Maintenance 1,000 0.41 1,000 0.29 1,000 0.40 1,000 0.31 Total Dist, and Whse. Costs 18,479 7.49 41.734 12.25 15,968 6.42 48,375 14.78 0.0 g Vi2 396 596 172 0 -677 253 . INTERNET MARKETING 498 Marketing variables gen- S/Q Rating weighted average erated by production and Models Available weighted average marketing decision in Y19. Brand Advertising 5000 Internet Retail Price per pairsold online Marketing Retail Price Exceeds Wholesale Price by Decisions Search Engine Advertising (5000) Free Shipping from warehouse to buy Marketing variables de Celebrity Appeal no com indien termined by prior year decisions outcomes Brand Reputation (priorysu image ratirol North America Market Year 12 Year 13 3.6* 3.6* 404 493 11,000 11,000 67.00 67.00 4996 49% 5,000 5000 No No 200 200 72 72 Year 12 Year 13 Actual Projected 23.3% 29.5% 556 760 Europe-Africa Market Year 12 Year 13 3.7* 3.7* 500 10,000 10,000 74.00 74.00 4096 40% 4,500 4500 No No - 205 205 72 72 Asia-Pacific Market Year 12 Year 13 4.0* 3.7* 400 480 9,000 9,000 67.00 67.00 49% 49% 4,000 4000- No No - 185 185 72 72 Latin America Market Year 12 Year 13 3.7* 3.6* 474 495 8,500 8,500 74.00 74.00 4096 40% 4,000 4000 No No 270 270 72 72 Internet Market Share (% of total regional sales volume) Internet Sales Volume (cos of pairs sold to online customer Year 12 Year 13 Actual Projected 24.8% 26.3% 504 Year 12 Year 13 Actual Projected 24.5% 27.4% 503 Year 12 Actual 26.596 429 Year 13 Projected 30.5% 546 587 397 stor 50 1.096 + ange $000s $/pair 50,920 67.00 0 0.00 50,920 67.00 9.500 12.50 60,420 79.50 27.776 36.65 9,860 12.97 12,000 15.79 1.574 2.07 9,210 12.12 15.2% $000s Spalr 43,438 74.00 500 0.85 43,938 74.85 7/338 12.50 51.276 87.35 19,247 32.79 7.565 12.89 9,811 16.37 1,216 2.07 13,637 23.23 20.6% Revenue, Cost, and Gross Internet Revenues Profit Projections Exchange Rate Adjustments for Year 13 Adjusted Gross Revenues + Shipping Fees paid by customer) Net Internet Revenues Cost of Pairs Sold Warehouse Expenses Marketing Expenses Administrative Expenses Operating Profit (Lon.) Operating Profit Margin Estimated industry averages S/Q Rating for the marketing are entered on the whole Models Available Marketing decision entry Brand Advertising 000 Competitive Retail Price Assumptions Search Engine Advertising 000 Free Shipping Industry average for the Celebrity Appeal be determined by priory Brand Reputation SO0Os $/pair 33,701 67.00 -327 -0.65 33,374 66.35 6,288 12.50 39,662 78.85 12,562 24.97 6,599 13.12 8,956 17.81 1,042 2.07 10,503 20.88 26.5% $000s S/pair 40,404 74.00 -1,822 -3.34 38,582 70.66 6,825 12.50 45,407 83.16 19,346 35.43 7,116 13.03 8,748 16.02 1.131 2.07 9,066 16.60 20.0% Y12 3.3% 1.5% 3.172 50 4.41 322 $ 12,900 $174.10 S350 Few 98 70 4.6* 333 $ 11,000 $177,60 $15050 Few 99 70 4.4% 293 $ 9,000 $ 171.20 SC 4100 Few 102 70 4.4* 311 $ 8,400 $78.10 $3150. Fow 98 70 WHOLESALE MARKETING Marketing variables gen S/Q Rating weighted average marketing decisions in Y18. Models Available weighted average Wholesale Wholesale Price to Retailers span Marketing Brand Advertising (5000 Decisions Mail-in Rebate 9 to $15 por part Delivery Time (1 to 4 wek delivery Retailer Support (50 to $10000 Retail Outlets witing to cry your brand Marketing variables de termined by prior year Celebrity Appeal am creeper decisions/Outcomes Brand Reputation priory image rating North America Market Year 12 Year 13 3.6* 3.6* 404 493 45.00 45.00 11,000 11000 5.00 5.00 - Europe-Africa Market Year 12 Year 13 3.7* 3.7* 498 500 53.00 53.00 10,000 10000 5.00 5.00 3 4,250 4250 835 1,133 205 205 72 72 Asia-Pacific Market Year 12 Year 13 4.0* 3.7* 400 480 45.00 45.00 9,000 9000 - 5.00 5.00 3 3- 3,000 3000 754 1,088 185 185 72 72 Latin America Market Year 12 Year 13 3.7* 3.6* 474 495 53.00 53.00 8,500 8500 - 5.00 5.00 - 3 3- 3,000 3000 585 852 270 270 72 72 3- 4.250 889 200 72 4250 823 200 72 Wholesale Market Share (% of total regional sales volume) Pairs Available for Sale (aer Sling inom orders 1000) Wholesale Demand for Branded Pairs Required Inventory needed to achievedelery time Surplus (Shortfall) of Branded Pairs Year 12 Year 13 Achal Projected 22.3% 23.6% 2,698 1,706 2.592 2,870 173 173 -67 -1,337 Year 12 Year 13 Actual Projected 22.3% 23.1% 2,616 2,821 2,212 2,400 244 269 34 152 Year 12 Year 13 Actual Projected 25.9% 28.4% 2,601 1,984 2,048 2,437 174 224 -313 -677 Year 12 Actual 24.2% 2,493 1,920 197 +370 Year 13 Projected 25.8% 2,727 2.225 249 +253 vestor ectation 3.50 23.096 3+ 72 hange em Y12 -3.394 51.5% 33,172 Revenue, Cost, and Profit Projections for Year 13 0.61 Gross Wholesale Revenues Exchange Rate Adjustments Net Wholesale Revenues Cost of Pairs Sold Warehouse Expenses Marketing Expenses Administrative Expenses Operating Profit (Loss) Operating Profit Margin $000s S/page 68,985 45.00 0 0.00 68,985 45.00 56,027 36.55 8,326 4.13 15,617 10.19 3,175 2.07 -12,160 -7.93 - 17.6% S000 S/pair 127,200 53.00 1,463 128,663 53.61 78,692 32.79 9,129 3.80 20,908 8.71 4,971 2.07 14,963 6.23 11.6% 5000s S/pair 79,200 45.00 -768 -0.44 78,432 44.56 43,956 24.98 7,369 4.19 16,172 9.19 3,646 2.07 7,289 4.14 9.3% $000s S/pair 117,925 53.00 -5,318 -2.39 112,607 50.61 78,838 35.43 8,859 3.98 16,851 7.57 4,608 2.07 3,451 1.56 3.1% GO Competitive Assumptions S/Q Rating Model Availability Wholesale Prices por pall Brand Advertising 5000 Rebate Offer is perpill Delivery Time (la Retailer Supporteret Retail Outlets Celebrity Appeal Brand Reputation 442 322 model $47.40 S 12900 $ 4.80 3.0 weeks $4600 1.425 98 70 4.6 333 al models $50.00 SL 11000 $[ 4.80 28. $ 4100 1,409 99 70 4.4.* 293 models $47.00 $ 9000 S[ 5.20 3.0 ks S[ 2850 300 102 70 4.4 * 311 models $50.80 $ 8400 $5.40 3.0 wooks $ 3050 307 98 70 abied by pro decisions and outcom 000 pair O pair 1,700 pair O pain 00.00 PROPOSED PRIVATE-LABEL PRODUCTION North America u Europe-Africa Asia-Pacific Latin America Facility Facility Facility Facility Private Label Materials Standard Materials % 86 0% 74% 0% Specifications Superior materials % 14- 0 % 26 - ) 0 Number of Models / Styles global requirement) 100 modelo O models 100 models O models Enhanced Styling / Features 8000 per modul SO model $0 model 12 model SO-model S/Q Rating of Private-Label Palrs to be produced Global Minimum 3.4* 2.6* 0.0* 3.6* 0.0* Capacity Available for Private-Label Production 600w of pain Private Label Pairs North America Warehouse 600 0 0 0 to be Produced Europe-Africa Warehouse 0 0 500 0 and Shipped to Asia-Pacific Warehouse before rejects 0 0 700 0 Latin America Warehouse 0 0 500 0 Proposed Total Production Regular Time O paire O pairs of Private Label Pairs pairs ce O pairs Overtime 1000s of pars 600 0 1,700 0 Paira Rejected Investor practition Net Private Label Production O pairs $3.50 Projected Cost of Private Label Pairs to be produced 23.0% B North America Europe-Africa Asia-Pacific Latin America PRIVATE-LABEL CONTRACT OFFERS 72 Market Market Market Market Charge from Y12 Private Label Demand 1,386 -3.396 Pairs Offered for Sale to be produced and -51.5% Price Offermato 10.00 S 31.00 $ 37,00 $ 32.00 -193,172 $37.00 Projected Private-Label Market Share oftoris accepted 42.1% 33.4% 44.3% 31.7% DO $000s Spalis 5000s S/pair S000 S/pair Soos S/pair Revenue, Cost, and Gross Private Label Revenues 17,794 31.00 16,872 37.00 20416 32.00 16,872 37.00 Margin Projections Exchange Rate Adjustments 0 0.00 194 0.43 -198 -0.31 -761 -1.67 for Year 13 Net Private-Label Revenues 17,794 31.00 17,066 37.43 20,218 31.69 16,111 35.33 Production Cost 16,388 28.55 9,845 21.59 13,774 21.59 9,845 21.59 + Exchange Rate Adjustments 0 0.00 -201 -0.44 0.00 359 0.79 Freight / Packaging/Tariffs 1,148 2.00 4,104 9.00 1,276 2.00 5,928 13.00 Margin Over Direct Costs 258 0.45 3,318 7.28 5,168 8.10 -21 -0.05 The projected outcome of winning a Private Label contract may Incorporate the pro Incorporate the pro- Incorporate the pro- Incorporate the pro- be included in the overall performance projections for the cur Jected outcomes for jected outcomes for lected outcomes for Jected outcomes for rent year. Select "Yes" for a region only if there is a reasonable this region into Y13 this region into 13 this region into Y13 this region into Y13 probability of winning a Private Label contract in the region. projections? No projections? No projections? No projections? No 26 AM 574 $28.55 0 O $0.00 1519 1,549 $21.59 $0.00 1,440 1.365 par 456 1.440 638 574 456 paire Projected Y13 Performance 6 Investor Scoring Measures Year 13 Expectation EPS (camingspershare) $0.73 $3.50 ROE (rotum on equity) 6.1% 28.096 Credit Rating C- Image Rating 70 Change Other Measures Year 13 from Y12 Net Revenues $0005) 586,452 Net Profit (5000s) 18,698 -51,5% Ending Cash (5000s),-199,172 -193,172 de