

Answered step by step
Verified Expert Solution
Question
1 Approved Answer
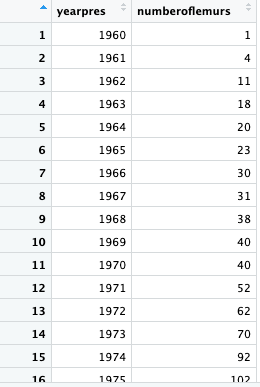
trying to plot the # of lemurs ( right column ) by year ( left column ) . How do I do this? table
trying to plot the # of lemurs right column by year left column How do I do this?
tableyearpres,numberoflemurs
Step by Step Solution
There are 3 Steps involved in it
Step: 1

Get Instant Access to Expert-Tailored Solutions
See step-by-step solutions with expert insights and AI powered tools for academic success
Step: 2

Step: 3
Ace Your Homework with AI
Get the answers you need in no time with our AI-driven, step-by-step assistance
Get Started
Database Systems For Advanced Applications 17th International Conference Dasfaa 2012 International Workshops Flashdb Items Snsm Sim Dqdi Busan South Korea April 2012 Proceedings Lncs 7240
Authors: Hwanjo Yu ,Ge Yu ,Wynne Hsu ,Yang-Sae Moon ,Rainer Unland ,Jaesoo Yoo
2012th Edition
3642290221, 978-3642290220