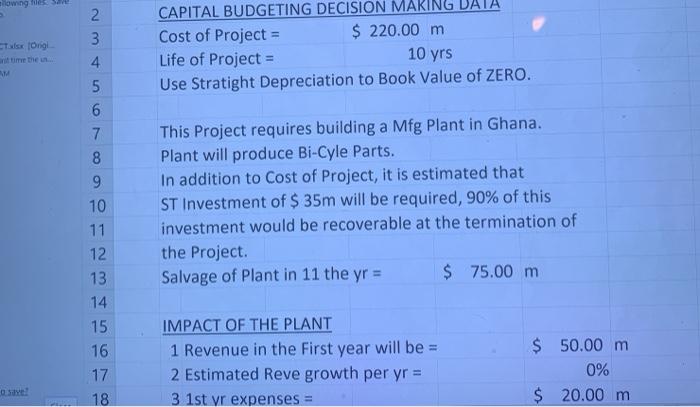
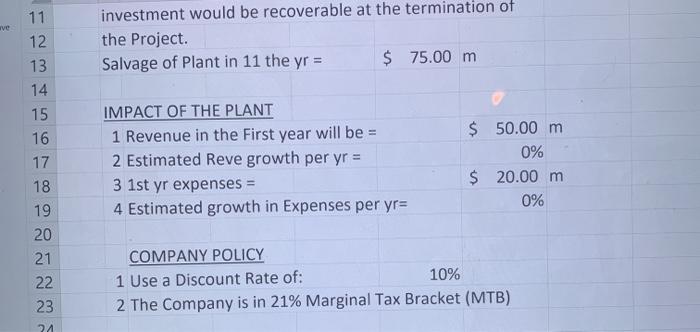
-Tulsa (Origt CAPITAL BUDGETING DECISION MARING DATA Cost of Project $ 220.00 m Life of Project = Use Stratight Depreciation to Book Value of ZERO. 10 yrs 2 3 4 5 6 7 8 9 10 11 12 13 14 15 16 17 18 This Project requires building a Mfg Plant in Ghana. Plant will produce Bi-Cyle Parts. In addition to Cost of Project, it is estimated that ST Investment of $ 35m will be required, 90% of this investment would be recoverable at the termination of the Project Salvage of Plant in 11 the yr = $ 75.00 m IMPACT OF THE PLANT 1 Revenue in the First year will be = 2 Estimated Reve growth per yr = 3 1st yr expenses = $ 50.00 m 0% $ 20.00 m de! ve investment would be recoverable at the termination of the Project. Salvage of Plant in 11 the yr = $ 75.00 m 11 12 13 14 15 16 17 18 19 IMPACT OF THE PLANT 1 Revenue in the First year will be = 2 Estimated Reve growth per yr = 3 1st yr expenses = 4 Estimated growth in Expenses per yr= $ 50.00 m 0% $ 20.00 m 0% 20 21 22 23 24 COMPANY POLICY 1 Use a Discount Rate of: 10% 2 The Company is in 21% Marginal Tax Bracket (MTB) 2 Calcualte Per year Revenue Expenses, and After Tax Cash Flow and Plot a GRAPH OF THESE ITEMS OVER 11 Year period X-Axis = Years Y-Axis = 3 Dollar items GRAPH IS NOT REQUIRED -Tulsa (Origt CAPITAL BUDGETING DECISION MARING DATA Cost of Project $ 220.00 m Life of Project = Use Stratight Depreciation to Book Value of ZERO. 10 yrs 2 3 4 5 6 7 8 9 10 11 12 13 14 15 16 17 18 This Project requires building a Mfg Plant in Ghana. Plant will produce Bi-Cyle Parts. In addition to Cost of Project, it is estimated that ST Investment of $ 35m will be required, 90% of this investment would be recoverable at the termination of the Project Salvage of Plant in 11 the yr = $ 75.00 m IMPACT OF THE PLANT 1 Revenue in the First year will be = 2 Estimated Reve growth per yr = 3 1st yr expenses = $ 50.00 m 0% $ 20.00 m de! ve investment would be recoverable at the termination of the Project. Salvage of Plant in 11 the yr = $ 75.00 m 11 12 13 14 15 16 17 18 19 IMPACT OF THE PLANT 1 Revenue in the First year will be = 2 Estimated Reve growth per yr = 3 1st yr expenses = 4 Estimated growth in Expenses per yr= $ 50.00 m 0% $ 20.00 m 0% 20 21 22 23 24 COMPANY POLICY 1 Use a Discount Rate of: 10% 2 The Company is in 21% Marginal Tax Bracket (MTB) 2 Calcualte Per year Revenue Expenses, and After Tax Cash Flow and Plot a GRAPH OF THESE ITEMS OVER 11 Year period X-Axis = Years Y-Axis = 3 Dollar items GRAPH IS NOT REQUIRED


