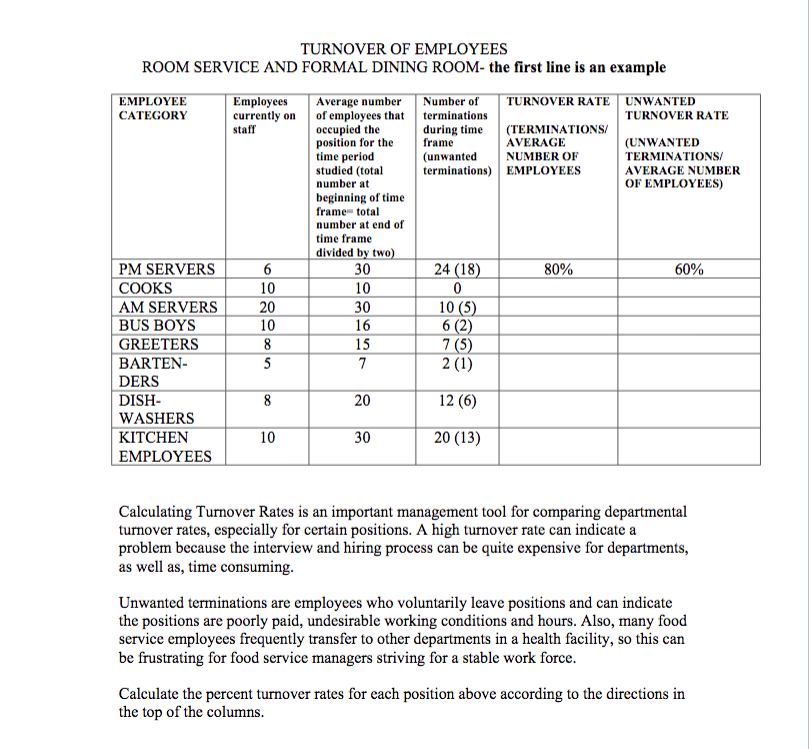
TURNOVER OF EMPLOYEES ROOM SERVICE AND FORMAL DINING ROOM- the first line is an example EMPLOYEE Employees Average number Number of TURNOVER RATE UNWANTED CATEGORY currently on of employees that terminations TURNOVER RATE staff occupied the during time (TERMINATIONS position for the frame AVERAGE (UNWANTED time period (unwanted NUMBER OF TERMINATIONS/ studied (total terminations) EMPLOYEES AVERAGE NUMBER number at OF EMPLOYEES) beginning of time frame total number at end of time frame divided by two) PM SERVERS 6 30 24 (18) 80% 60% COOKS 10 10 0 AM SERVERS 20 30 10 (5) BUS BOYS 10 16 6 (2) GREETERS 8 15 BARTEN- 5 7 2 (1) DERS DISH- 8 20 12 (6) WASHERS KITCHEN 10 30 20 (13) EMPLOYEES 7 (5) Calculating Turnover Rates is an important management tool for comparing departmental turnover rates, especially for certain positions. A high turnover rate can indicate a problem because the interview and hiring process can be quite expensive for departments, as well as, time consuming. Unwanted terminations are employees who voluntarily leave positions and can indicate the positions are poorly paid, undesirable working conditions and hours. Also, many food service employees frequently transfer to other departments in a health facility, so this can be frustrating for food service managers striving for a stable work force. Calculate the percent turnover rates for each position above according to the directions in the top of the columns. TURNOVER OF EMPLOYEES ROOM SERVICE AND FORMAL DINING ROOM- the first line is an example EMPLOYEE Employees Average number Number of TURNOVER RATE UNWANTED CATEGORY currently on of employees that terminations TURNOVER RATE staff occupied the during time (TERMINATIONS position for the frame AVERAGE (UNWANTED time period (unwanted NUMBER OF TERMINATIONS/ studied (total terminations) EMPLOYEES AVERAGE NUMBER number at OF EMPLOYEES) beginning of time frame total number at end of time frame divided by two) PM SERVERS 6 30 24 (18) 80% 60% COOKS 10 10 0 AM SERVERS 20 30 10 (5) BUS BOYS 10 16 6 (2) GREETERS 8 15 BARTEN- 5 7 2 (1) DERS DISH- 8 20 12 (6) WASHERS KITCHEN 10 30 20 (13) EMPLOYEES 7 (5) Calculating Turnover Rates is an important management tool for comparing departmental turnover rates, especially for certain positions. A high turnover rate can indicate a problem because the interview and hiring process can be quite expensive for departments, as well as, time consuming. Unwanted terminations are employees who voluntarily leave positions and can indicate the positions are poorly paid, undesirable working conditions and hours. Also, many food service employees frequently transfer to other departments in a health facility, so this can be frustrating for food service managers striving for a stable work force. Calculate the percent turnover rates for each position above according to the directions in the top of the columns


