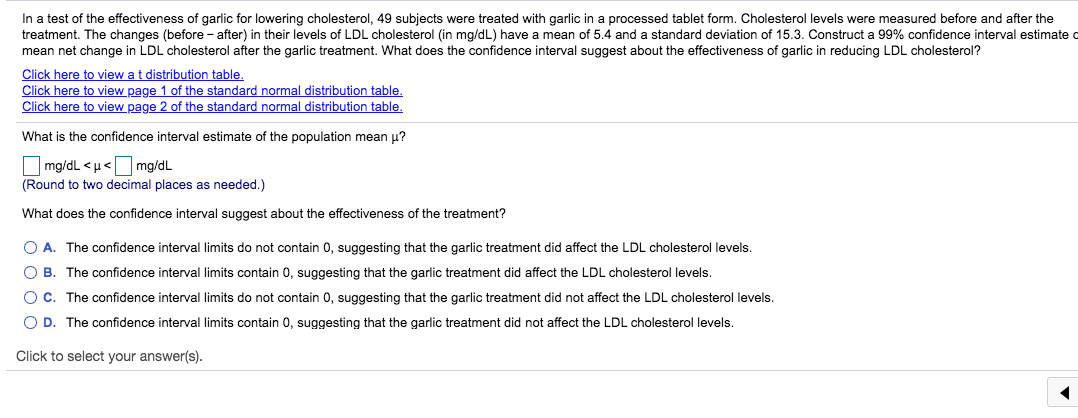
Twelve different video games showing substance use were observed and the duration of times of game playr (in seconds} are listed below. The design of the study justies the assumption that the sample can be treated as a simple random sample. Use the sample data to construct a 99% condence interval estimate of t5, the standard deviation of the duration times of game play. Assume that this sample was obtained from a population with a normal distribution. 4,514 4,353 4,513 5,343 5,327 3,332 g, 4,153 4,313 4,143 4,371 4,502 4,331 3 Click the icon to View the table of ChiSquare critical values. The condence interval estimate is see 5.8% O C. Ho: p= 5.8% H1: p 25.8% O D. Ho: p=5.8% H,: ps 5.8%In a test of the effectiveness of garlic for lowering cholesterol, 49 subjects were treated with garlic in a processed tablet form. Cholesterol levels were measured before and after the treatment. The changes (before - after) in their levels of LDL cholesterol (in mg/dL) have a mean of 5.4 and a standard deviation of 15.3. Construct a 99% confidence interval estimate mean net change in LDL cholesterol after the garlic treatment. What does the confidence interval suggest about the effectiveness of garlic in reducing LDL cholesterol? Click here to view a t distribution table. Click here to view page 1 of the standard normal distribution table. Click here to view page 2 of the standard normal distribution table. What is the confidence interval estimate of the population mean ? mg/dL 0.24 O C. Ho: P#0.24 H1: p=0.24 O D. Ho: P= 0.24 H1: p #0.24Suppose that in a random selection of 100 colored candies, 20% of them are blue. The candy company claims that the percentage of blue candies is equal to 24%. Use a 0.01 significance level to test that claim. Identify the test statistic for this hypothesis test. The test statistic for this hypothesis test is (Round to two decimal places as needed.) Identify the P-value for this hypothesis test. The P-value for this hypothesis test is]. (Round to three decimal places as needed.) Identify the conclusion for this hypothesis test. O A. Reject Ho. There is not sufficient evidence to warrant rejection of the claim that the percentage of blue candies is equal to 24% O B. Fail to reject Ho. There is sufficient evidence to warrant rejection of the claim that the percentage of blue candies is equal to 24% C. Reject Ho. There is sufficient evidence to warrant rejection of the claim that the percentage of blue candies is equal to 24%


