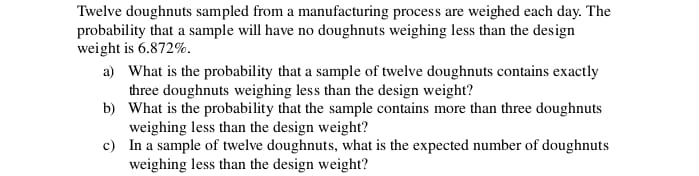
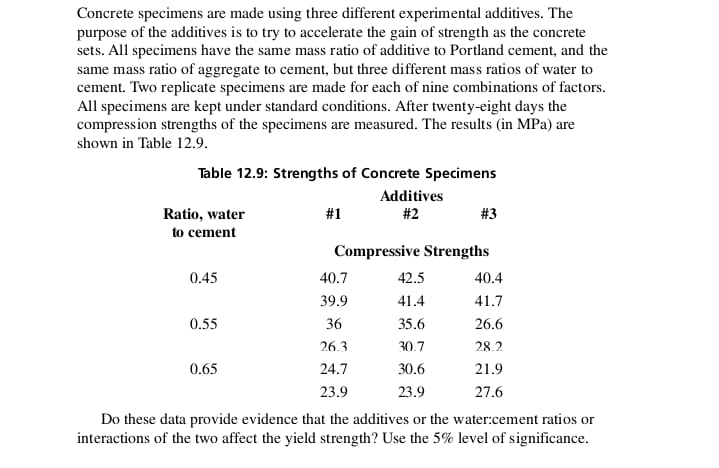
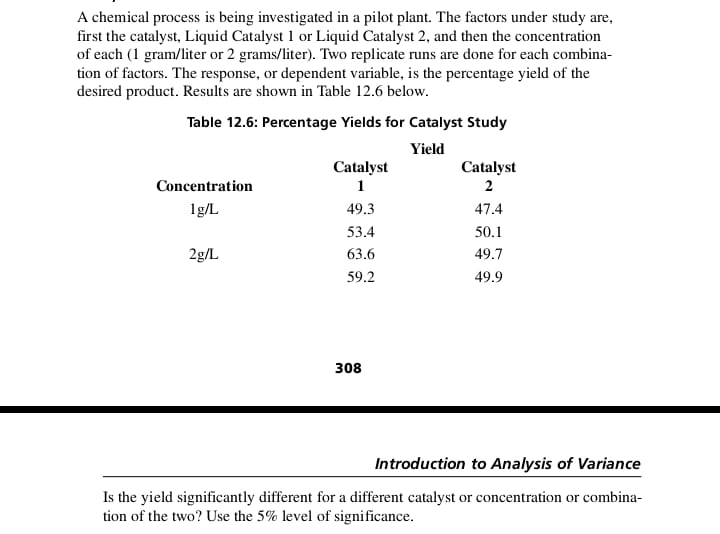
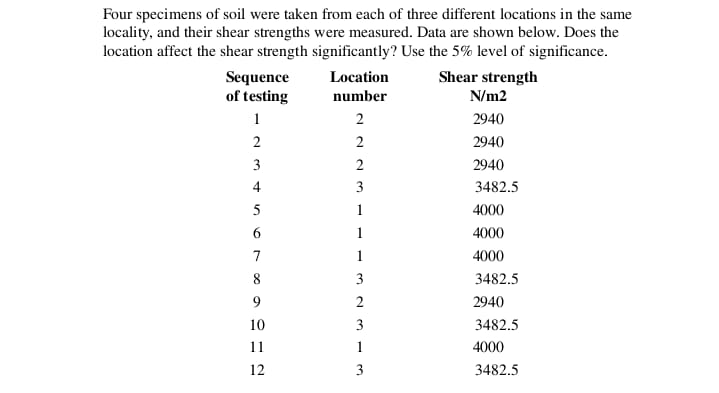
Twelve doughnuts sampled from a manufacturing process are weighed each day. The probability that a sample will have no doughnuts weighing less than the design weight is 6.872%. a) What is the probability that a sample of twelve doughnuts contains exactly three doughnuts weighing less than the design weight? b) What is the probability that the sample contains more than three doughnuts weighing less than the design weight? c) In a sample of twelve doughnuts, what is the expected number of doughnuts weighing less than the design weight?Concrete specimens are made using three different experimental additives. The purpose of the additives is to try to accelerate the gain of strength as the concrete sets. All specimens have the same mass ratio of additive to Portland cement, and the same mass ratio of aggregate to cement, but three different mass ratios of water to cement. Two replicate specimens are made for each of nine combinations of factors. All specimens are kept under standard conditions. After twenty-eight days the compression strengths of the specimens are measured. The results (in MPa) are shown in Table 12.9. Table 12.9: Strengths of Concrete Specimens Additives Ratio, water #1 #2 #3 to cement Compressive Strengths 0.45 40.7 42.5 40.4 39.9 41.4 41.7 0.55 36 35.6 26.6 26.3 30.7 28.2 0.65 24.7 30.6 21.9 23.9 23.9 27.6 Do these data provide evidence that the additives or the water:cement ratios or interactions of the two affect the yield strength? Use the 5% level of significance.A chemical process is being investigated in a pilot plant. The factors under study are, first the catalyst, Liquid Catalyst 1 or Liquid Catalyst 2, and then the concentration of each (1 gram/liter or 2 grams/liter). Two replicate runs are done for each combina- tion of factors. The response, or dependent variable, is the percentage yield of the desired product. Results are shown in Table 12.6 below. Table 12.6: Percentage Yields for Catalyst Study Yield Catalyst Catalyst Concentration 1 2 1g/L 49.3 47.4 53.4 50.1 2g/L 63.6 49.7 59.2 49.9 308 Introduction to Analysis of Variance Is the yield significantly different for a different catalyst or concentration or combina- tion of the two? Use the 5% level of significance.Four specimens of soil were taken from each of three different locations in the same locality, and their shear strengths were measured. Data are shown below. Does the location affect the shear strength significantly? Use the 5% level of significance. Sequence Location Shear strength of testing number N/m2 2940 2940 2940 3482.5 4000 4000 WEWNW--SWNNN 4000 3482.5 2940 3482.5 4000 12 3482.5A stirred liquid-phase reactor produces a polymer used (in small concentrations) to increase rates of filtration. A pilot plant has been built to investigate this process. The factors being studied are temperature, concentration of reactant A, concentration of reactant B, and stirring rate. Each factor will be studied at two levels in a factorial design, and each combination of conditions will be repeated to give two replications. a) How many tests will be required? b) List all tests. c) What order of tests should be used?Mechanical components are being produced continuously. A quality control program for the mechanical components requires a close estimate of the proportion defective in production when all settings are correct. 1020 components are examined under these conditions, and 27 of the 1020 items are found to be defective. (a) Find a point estimate of the proportion defective. (b) Find a 95% two-sided confidence interval. (c) Find an upper limit giving 95% level of confidence that the true proportion defective is less than this limiting value. Use Excel in parts (b) and (c).Mechanical components are produced continuously in large numbers on a production line. When the machines are correctly adjusted, extensive data show that the propor- tion of defective components is 0.027. If the proportion of defectives in a sample of size 50 is so large that the result is significant at the 5% level, the production line will be stopped for adjustment. a) What probability distribution applies? b) What is the smallest proportion of defective items in a sample of 50 that will stop the production line