Answered step by step
Verified Expert Solution
Question
1 Approved Answer
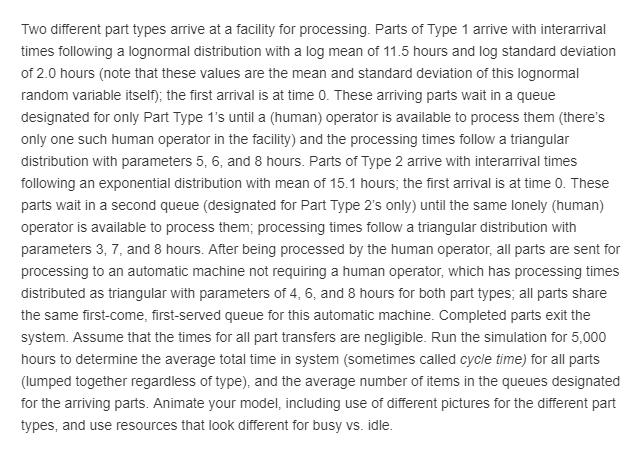
Two different part types arrive at a facility for processing. Parts of Type 1 arrive with interarrival times following a lognormal distribution with a

Two different part types arrive at a facility for processing. Parts of Type 1 arrive with interarrival times following a lognormal distribution with a log mean of 11.5 hours and log standard deviation of 2.0 hours (note that these values are the mean and standard deviation of this lognormal random variable itself); the first arrival is at time 0. These arriving parts wait in a queue designated for only Part Type 1's until a (human) operator is available to process them (there's only one such human operator in the facility) and the processing times follow a triangular distribution with parameters 5, 6, and 8 hours. Parts of Type 2 arrive with interarrival times following an exponential distribution with mean of 15.1 hours; the first arrival is at time 0. These parts wait in a second queue (designated for Part Type 2's only) until the same lonely (human) operator is available to process them; processing times follow a triangular distribution with parameters 3, 7, and 8 hours. After being processed by the human operator, all parts are sent for processing to an automatic machine not requiring a human operator, which has processing times distributed as triangular with parameters of 4, 6, and 8 hours for both part types; all parts share the same first-come, first-served queue for this automatic machine. Completed parts exit the system. Assume that the times for all part transfers are negligible. Run the simulation for 5,000 hours to determine the average total time in system (sometimes called cycle time) for all parts (lumped together regardless of type), and the average number of items in the queues designated for the arriving parts. Animate your model, including use of different pictures for the different part types, and use resources that look different for busy vs. idle.
Step by Step Solution
There are 3 Steps involved in it
Step: 1
Required solution The Simulation Model of the workstation Note From th...
Get Instant Access to Expert-Tailored Solutions
See step-by-step solutions with expert insights and AI powered tools for academic success
Step: 2

Step: 3

Ace Your Homework with AI
Get the answers you need in no time with our AI-driven, step-by-step assistance
Get Started


