Answered step by step
Verified Expert Solution
Question
1 Approved Answer
Two groups of drivers are surveyed to see how many kilometers per week they drive for pleasure trips. The recorded data were analyzed using SPSS
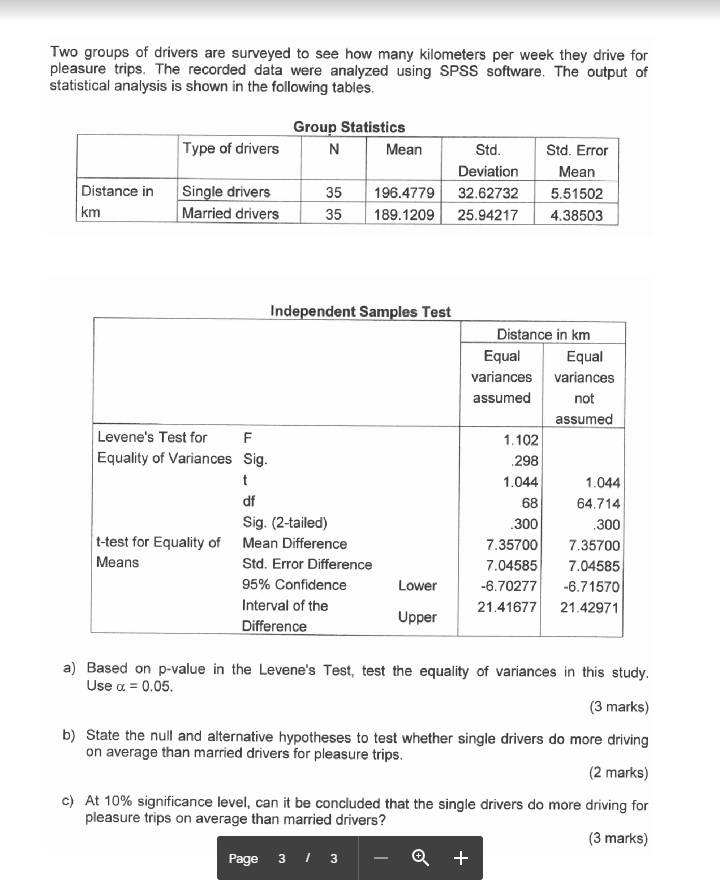
Two groups of drivers are surveyed to see how many kilometers per week they drive for pleasure trips. The recorded data were analyzed using SPSS software. The output of statistical analysis is shown in the following tables. Group Statistics Type of drivers N Mean Std. Std. Error Deviation Mean Distance in Single drivers 35 196.4779 32.62732 5.51502 km Married drivers 35 189.1209 25.94217 4.38503 Independent Samples Test Distance in km Equal Equal variances variances assumed not assumed Levene's Test for F 1.102 Equality of Variances Sig. 298 1.044 1.044 df 68 64.714 Sig. (2-tailed) .300 300 t-test for Equality of Mean Difference 7.35700 7.35700 Means Std. Error Difference 7.04585 7.04585 95% Confidence Lower -6.70277 -6.71570 Interval of the 21.41677 21.42971 Upper Difference a) Based on p-value in the Levene's Test, test the equality of variances in this study. Use a = 0.05. (3 marks) b) State the null and alternative hypotheses to test whether single drivers do more driving on average than married drivers for pleasure trips. (2 marks) c) At 10% significance level, can it be concluded that the single drivers do more driving for pleasure trips on average than married drivers? (3 marks) Page 3 3 +
Step by Step Solution
There are 3 Steps involved in it
Step: 1
Get Instant Access to Expert-Tailored Solutions
See step-by-step solutions with expert insights and AI powered tools for academic success
Step: 2
Step: 3
Ace Your Homework with AI
Get the answers you need in no time with our AI-driven, step-by-step assistance
Get Started